Prometheus Agent
Prometheus is an open-source monitoring and alerting system that is designed to collect and analyze metrics from various systems and services.
Prometheus is built around a time-series database that stores metrics data. It uses a flexible querying language called PromQL to extract and process metrics data. Prometheus also has a powerful alerting system that can be used to send notifications when specific conditions are met.
Prometheus can be used to monitor a wide range of systems and services, including servers, containers, databases, and applications. It can be deployed in a variety of environments, including on-prem, cloud, and hybrid setups.
The Prometheus Agent pack works in tandem with the Prometheus Operator pack. Check out the guides Deploy Monitoring Stack and Enable Monitoring on Host Cluster to learn how to create a monitoring stack with Prometheus for your Palette environment.
Versions Supported
19.0.X
Prerequisites
- A host cluster that has the Prometheus Operator pack installed.
Parameters
The Prometheus agent supports all the parameters exposed by the Prometheus Helm Chart. Refer to the Prometheus Helm Chart documentation for details.
From a Palette perspective, you must provide a value for the remoteWrite.url parameter shown in the following example.
charts:
  prometheus:
    server:
      remoteWrite:
        - url: ""
The remoteWrite.url is exposed by the Prometheus Operator pack when installed in a cluster.
You can find the Prometheus server URL by reviewing the details of the Kubernetes cluster hosting the Prometheus server.
Use the URL exposed by the Prometheus service.
The following image displays a host cluster with the Prometheus Operator pack installed. Use the URL exposed for port
9090 to populate the remoteWrite.url parameter.
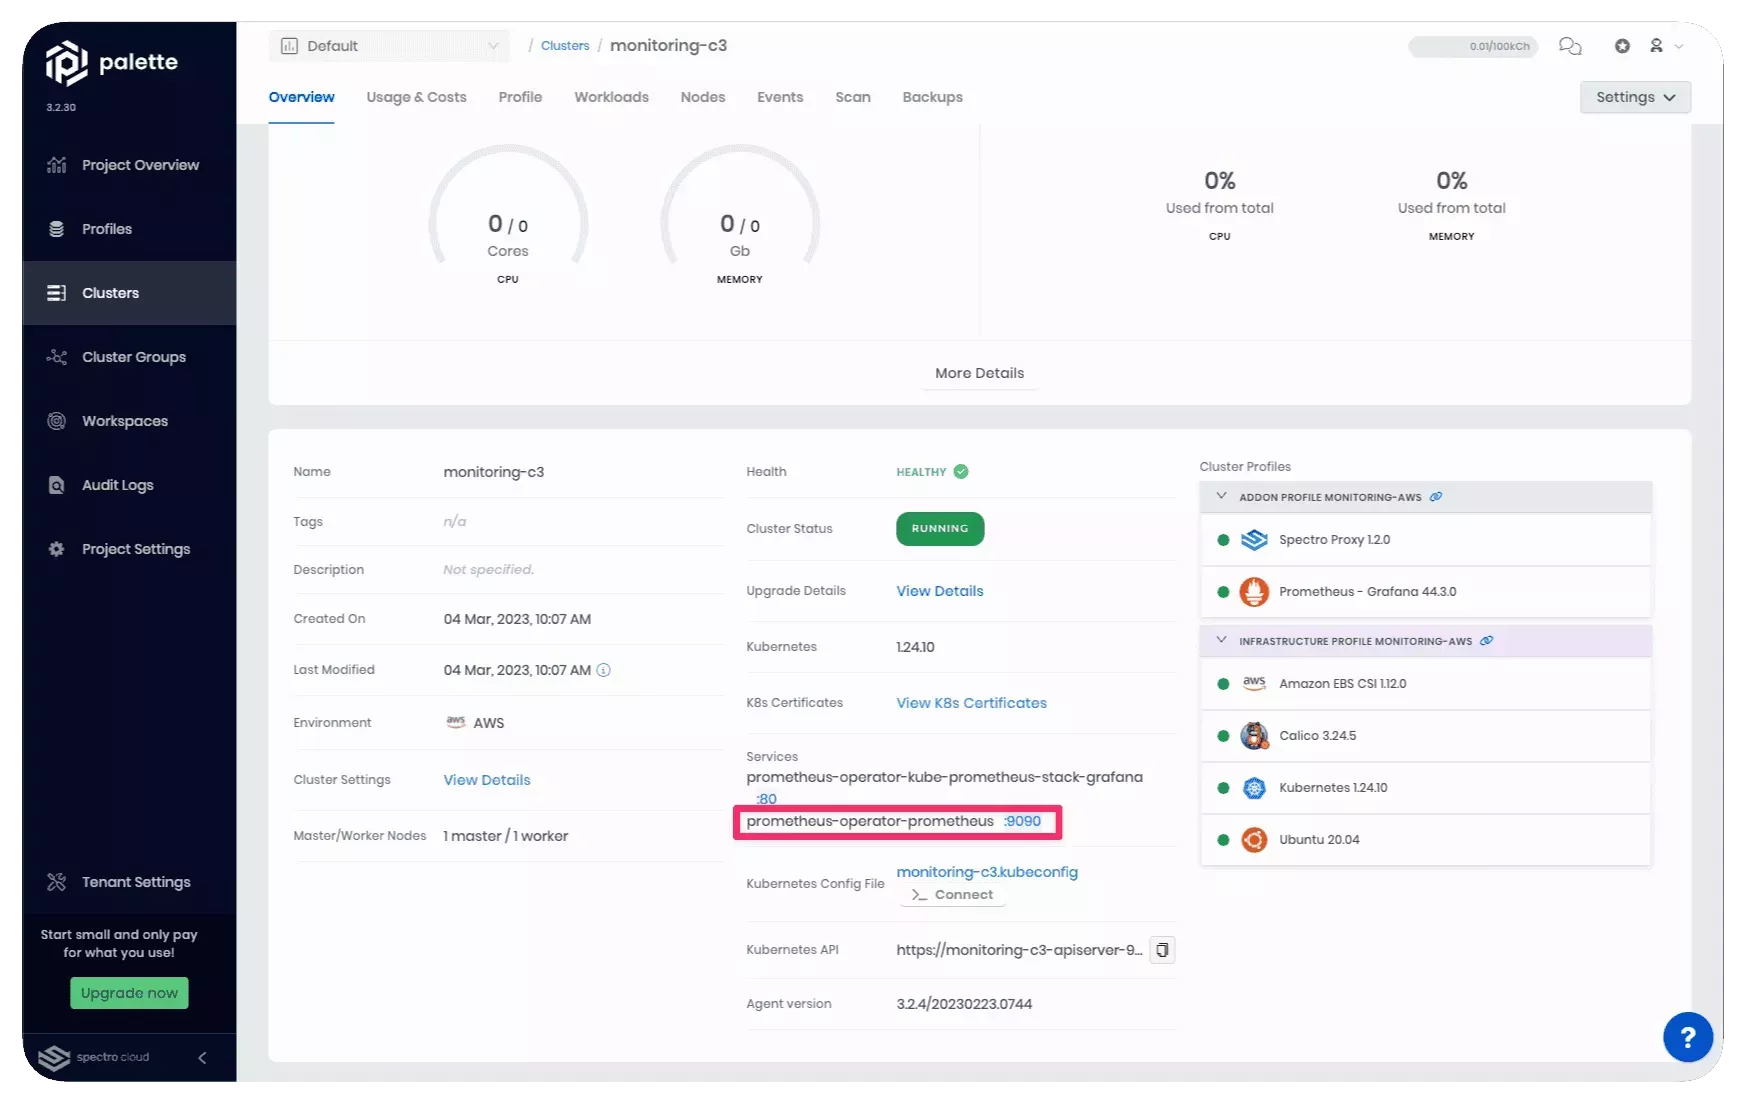
The Prometheus server URL must be in the format http://HOST:PORT/api/v1/write. Example:
http://a2c938972938b4f0daee5f56edbd40af-1690032247.us-east-1.elb.amazonaws.com:9090/api/v1/write
If the Prometheus server is configured with authentication, add the authentication parameters. Replace <USERNAME> and
<PASSWORD> with the actual credential values.
charts:
  prometheus:
    server:
      remoteWrite:
        - url: ""
          remote_timeout: "5s"
          basic_auth:
            username: "<USERNAME>"
            password: <PASSWORD>
Usage
The Prometheus agent pack works out-of-the-box and only requires you to provide a Prometheus server URL. Add the Prometheus agent pack to a cluster profile to get started with Prometheus. You can create a new cluster profile that has the Prometheus agent as an add-on pack or you can update an existing cluster profile by adding the Prometheus agent pack. For guidance, review Update a Cluster Profile.
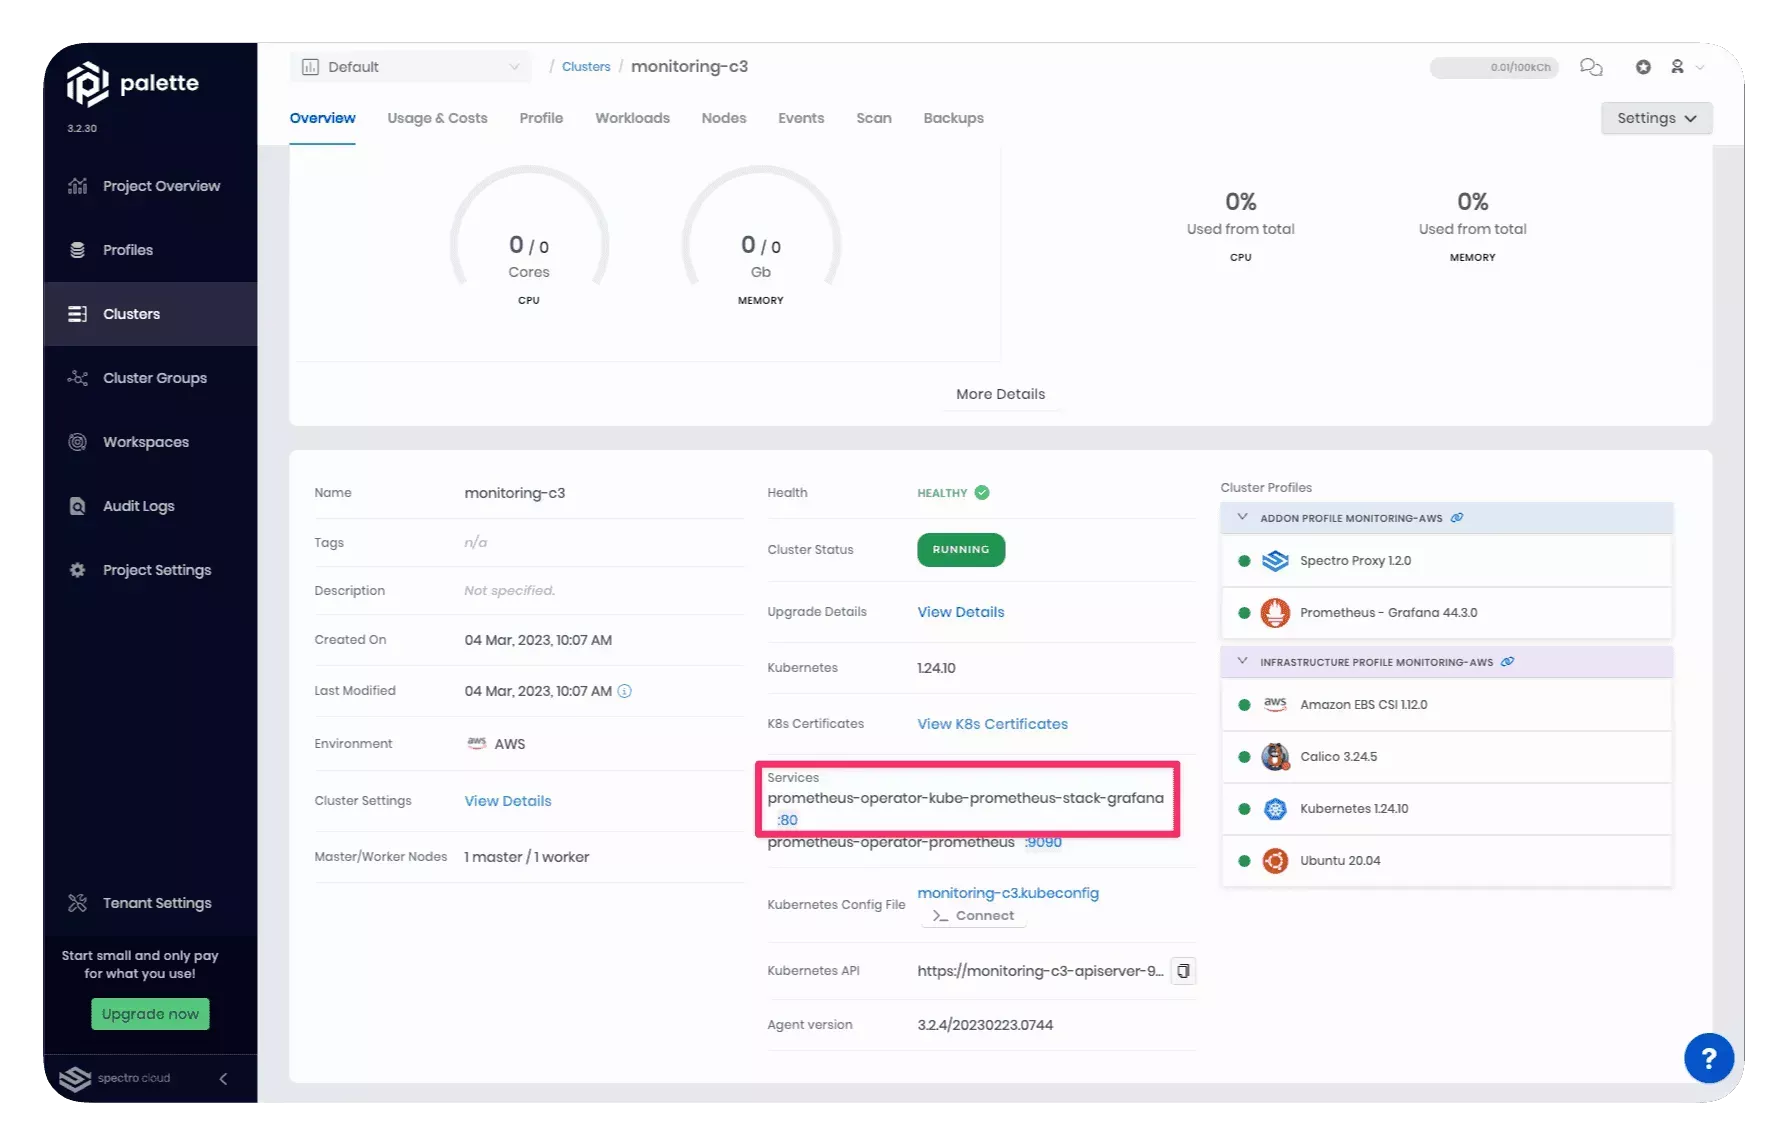
Log in to the Grafana dashboard to view and create dashboards. You can find the Grafana dashboard URL by reviewing the details of the Kubernetes cluster hosting the Prometheus server. Use the URL exposed by the prometheus-operator-kube-prometheus-stack-grafana service.
Palette exposes a set of Grafana dashboards by default. You can find the Spectro Cloud dashboards by navigating to Grafana's left Main Menu > Dashboards and expanding the Spectro Cloud folder.
The following dashboards are available by default:
-
Kubernetes/System/API Server: A view of the resources and status of the Kubernetes cluster hosting the Prometheus server.
-
Kubernetes/Views/Global: An aggregate view of all the resources used by Kubernetes clusters.
-
Kubernetes/Views/Namespaces: An aggregate view of all the resources used by a specific Kubernetes namespace.
-
Kubernetes/Views/Nodes: A view of all nodes with the Prometheus agent installed.
-
Kubernetes/Views/Pods: A view of all the pods in a node with the Prometheus agent installed.
Use the filters to narrow down the information displayed. All Palette dashboards include the project and cluster filter.
We encourage you to check out the Grafana tutorials and learning resources to learn more about Grafana.
Terraform
You can retrieve details about the Prometheus agent pack by using the following Terraform code.
data "spectrocloud_registry" "public_registry" {
  name = "Public Repo"
}

data "spectrocloud_pack_simple" "pack-info" {
  name         = "prometheus-agent"
  version      = "19.0.2"
  type         = "helm"
  registry_uid = data.spectrocloud_registry.public_registry.id
}