Deploy Monitoring Stack
The monitoring stack you will deploy uses the open source tool, Prometheus, to support your environment's monitoring requirements. The monitoring stack is a centralized server or aggregation spot to which all other clusters will forward metrics. The monitoring stack is a dedicated Kubernetes cluster for monitoring and metrics aggregation in your Palette environment.
The monitoring stack uses a server-client architecture. The monitoring stack uses the Prometheus Operator pack to deploy all the dependencies the Prometheus server requires. The server exposes an API endpoint for all other clients to forward metrics. The clients are Kubernetes clusters with the Prometheus Agent pack installed and configured.
Use the following steps to deploy a monitoring stack, and learn how to configure a host cluster to forward metrics to the monitoring stack.
We recommend you avoid installing applications in your monitoring stack. The monitoring stack will require all the allocated resources to support Prometheus and incoming metrics from all other clusters.
Deploy a Monitoring Stack
The steps below will deploy a new host cluster with the Prometheus Operator pack. You can add the Prometheus Operator pack to an existing cluster if you already have a host cluster deployed in your environment.
The Prometheus Operator pack will install an unsecured Prometheus server by default. Use the With Authentication and Encryption tab for guidance on how to enable authentication.
You can choose to deploy the monitoring stack with or without authentication.
Without Authentication
Prerequisites
-
An infrastructure provider environment registered in Palette. Refer to the Clusters documentation for guidance on how to register your infrastructure provider environment in Palette.
-
The minimum required size for the Prometheus server is 4 CPU, 8 GB Memory, and 10 GB Storage. We recommend the monitoring stack have 1.5x to 2x the minimum required size:
Recommended size:
- 8 CPU
- 16 GB Memory
- 20 GB Storage.
As new clusters with the Prometheus agent are added to your environment, review the resource utilization and consider increasing resources if needed. As the Prometheus documentation recommends, each additional agent requires the following resources from the monitoring stack:
Each added agent:
-
0.1 CPU
-
250 MiB Memory
-
1 GB Storage.
Refer to the Prometheus Operational aspects documentation for additional guidance.
Create Cluster Profile and Deploy
-
Log in to Palette.
-
Navigate to the left Main Menu and select Profiles.
-
Click on Add Cluster Profile to create a new cluster profile.
-
Provide the cluster profile a name and select the type Full. Click on Next.
-
Select the infrastructure provider and continue.
-
Go ahead and select the desired operating system, Kubernetes distribution, container network interface (CNI), and container storage interface (CSI). Click on Next Layer after each selection. When you have completed selecting core infrastructure for the profile, click Confirm.
-
In the next screen that displays, select Add New Pack.
-
Use the following information to find the Prometheus Operator pack.
- Pack Type: Monitoring
- Registry: Public Repo
- Pack Name: Prometheus Grafana
- Pack Version: 44.25.X or newer.
-
Review the YAML configuration on the right. Scroll down in the file until you find the parameter
adminPassword. Input the password value for the admin user. The default admin user name isadmin. -
Next, click on the Presets button to expand the options drawer.
- Scroll down the presets option menu and enable Remote Monitoring. Confirm your changes. You can enable several options to expand the functionality of the monitoring stack. Review the Prometheus Operator pack documentation to learn more about the available options.
-
Confirm your changes by selecting Confirm & Create.
-
Click on Add New Pack.
-
Use the following information to find the Spectro Cluster Metrics pack.
- Pack Type: Monitoring
- Registry: Public Repo
- Pack Name: Spectro Cluster Metrics
- Pack Version: 3.3.X or newer
-
Use the default values. Confirm your changes by selecting Confirm & Create.
-
Click on Add New Pack.
-
Use the following information to find the Spectro Grafana Dashboards pack.
- Pack Type: Monitoring
- Registry: Public Repo
- Pack Name: Spectro Grafana Dashboards
- Pack Version: 4.0.X or newer
-
Use the default values. Confirm your changes by selecting Confirm & Create.
-
Click on Next to review the cluster profile and save it.
-
Navigate to the left Main Menu and select Clusters.
-
Click on Add New Cluster. Select Deploy New Cluster.
-
Choose the infrastructure provider you selected for the cluster profile you created earlier.
-
Assign a name to the host cluster and select the registered account you will deploy it to. Click on Next.
-
Choose the cluster profile you created earlier and complete the remainder of the cluster creation process.
When you deploy the cluster, a host cluster with Prometheus will be installed and ready to receive information from Prometheus agents.
Validate
To validate the monitoring stack is successfully deployed and ready to receive Prometheus agent requests, use the following steps.
-
Log in to Palette.
-
Navigate to the left Main Menu and select Clusters.
-
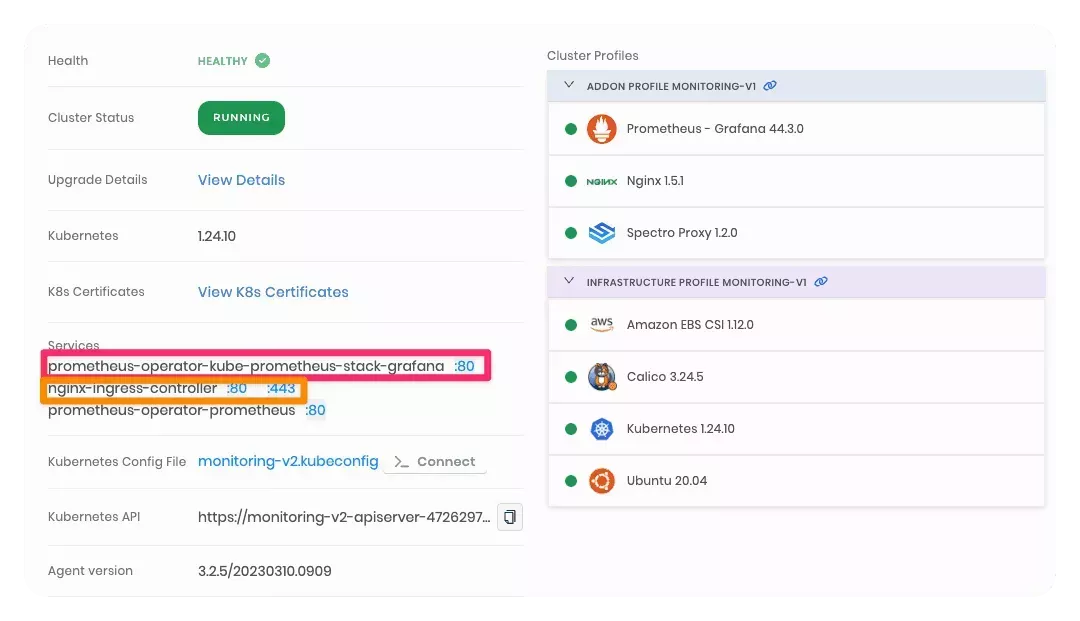
Select the monitoring stack cluster to review the details page.
-
Ensure the cluster is in Running state.
-
Click on the exposed service URL for the service prometheus-operator-kube-prometheus-stack-grafana.
-
Log in to the Grafana dashboard using the user
adminand the password you specified in the cluster profile.
With Authentication and Encryption
To enable Hypertext Transfer Protocol Secure (HTTPS), you must make several architectural decisions and decide on various options for setting up the environment. These options range from choosing what will generate the Secure Socket Layer (SSL) certificates to how incoming requests for Grafana or Prometheus are handled.
The approach presented in this guide is one pattern you can use. However, we encourage you to discuss this pattern with your system administrator or platform engineering team before changing your infrastructure and Domain Name System (DNS) resources.
The following diagram represents the infrastructure pattern you will use in this guide to enable HTTPS.
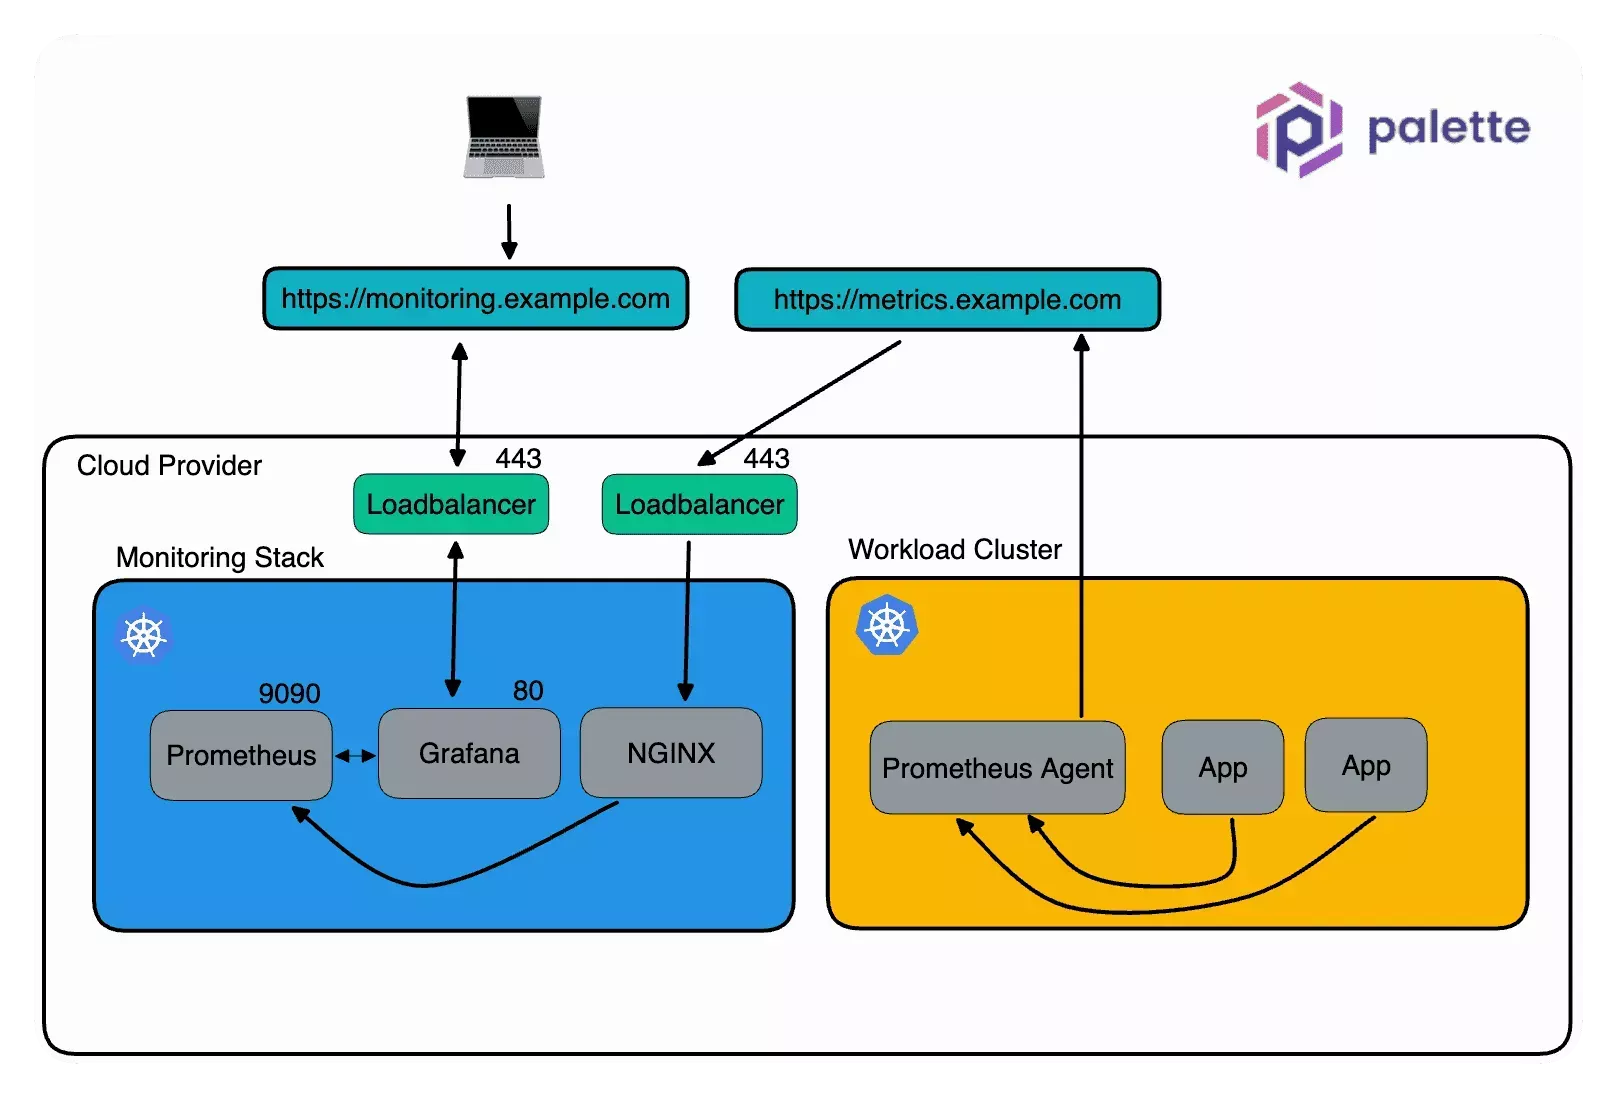
In this guide, the following domains are used to expose the monitoring stack:
| Domain | Description |
|---|---|
metrics.example.com | The endpoint that all host clusters will forward Prometheus metrics. |
monitoring.example.com | The Grafana dashboard. |
Prerequisites
-
Experience with DNS and setting up custom domains that use SSL certificates are required for this guide. In addition, the following actions are needed.
-
Ability to create and update DNS record names.
-
Two custom domain names. One domain is for the Grafana dashboard, and another is for host clusters to forward metrics to the monitoring stack.
-
Ability to create a public certificate for each domain.
-
-
An infrastructure provider environment registered in Palette. Refer to the Clusters documentation for guidance on how to register your infrastructure provider environment in Palette.
-
htpasswd or similar basic auth password file generator tool.
-
The minimum required size for the Prometheus server is 4 CPU, 8 GB Memory, and 10 GB Storage. We recommend the monitoring stack have 1.5x to 2x the minimum required size:
Recommended size:
- 8 CPU
- 16 GB Memory
- 20 GB Storage.
As new clusters with the Prometheus agent are added to your environment, review the resource utilization and consider increasing resources if needed. As the Prometheus documentation recommends, each additional agent requires the following resources from the monitoring stack:
Each added agent:
- 0.1 CPU
- 250 MiB Memory
- 1 GB Storage.
Refer to the Prometheus Operational aspects documentation for additional guidance.
Create Cluster Profile and Deploy
-
Log in to Palette.
-
Navigate to the left Main Menu and select Profiles.
-
Click on Add Cluster Profile to create a new cluster profile.
-
Provide the cluster profile a name and select the type Full. Click on Next.
-
Select the infrastructure provider and continue.
-
Go ahead and select the desired operating system, Kubernetes distribution, container network interface (CNI), and container storage interface (CSI). Click on Next Layer after each selection. When you have completed selecting core infrastructure for the profile, click Confirm.
-
In the next screen that displays, select Add New Pack.
-
Use the following information to add the Nginx ingress controller pack.
- Pack Type: Ingress
- Registry: Public Repo
- Pack Name: Nginx
- Pack Version: 1.5.X or newer.
-
Review the YAML configuration on the right and add the following changes:
charts:
  ingress-nginx:
    controller:
      extraArgs:
        enable-ssl-passthrough: true
-
Click on Confirm & Create.
-
Select Add New Pack.
-
Use the following information to find the Prometheus Operator pack.
- Pack Type: Monitoring
- Registry: Public Repo
- Pack Name: Prometheus Grafana
- Pack Version: 44.3.X or newer.
-
Next, click on the Presets button to expand the options drawer.
-
Scroll down the presets option menu and enable Remote Monitoring.
-
Review the YAML configuration on the right. Scroll down in the file until you find the parameter
grafana.adminPassword. Input the password value for the admin user. The default admin user name isadmin.
charts:
  kube-prometheus-stack:
    grafana:
adminPassword: "YourPassword" -
Next, update the
prometheus.service.typeparameter toClusterIP.
charts:
  kube-prometheus-stack:
    prometheus:
      service:
        type: ClusterIP
- Confirm your changes by selecting Confirm & Create. You can enable several options to expand the functionality of the monitoring stack. Review the Prometheus Operator pack documentation to learn more about the available options.
-
Click on Add New Pack.
-
Use the following information to find the Spectro Cluster Metrics pack.
- Pack Type: Monitoring
- Registry: Public Repo
- Pack Name: Spectro Cluster Metrics
- Pack Version: 3.3.X or newer
-
Use the default values. Confirm your changes by selecting Confirm & Create.
-
Click on Add New Pack.
-
Use the following information to find the Spectro Grafana Dashboards pack.
- Pack Type: Monitoring
- Registry: Public Repo
- Pack Name: Spectro Grafana Dashboards
- Pack Version: 1.0.X or newer
-
Use the default values. Confirm your changes by selecting Confirm & Create.
-
Click on Next to review the cluster profile and save it.
-
Navigate to the left Main Menu and select Clusters.
-
Click on Add New Cluster. Select Deploy New Cluster.
-
Choose the infrastructure provider you selected for the cluster profile you created earlier.
-
Assign a name to the host cluster and select the registered account you will deploy it to. Click on Next.
-
Choose the cluster profile you created earlier and complete the remainder of the cluster creation process.
-
Once the host cluster is deployed, navigate to the left Main Menu and select Clusters. Click on your cluster to display the details page and ensure its status is Running.
-
Download the Kubernetes configuration file. Click on the URL that has the name of your cluster followed by a period and the word kubeconfig. Refer to the Access Cluster with CLI for additional guidance.
-
Open a terminal window and set the environment variable
KUBECONFIGto point to kubeconfig file you downloaded.
export KUBECONFIG=~/Downloads/dev-monitoring-stack.config -
Create an htpasswd file for the user
agentand assign a password. You can choose a different username if you prefer.
htpasswd -c auth agentOutput:
New password: [agent_password_here]
New password:
Re-type new password:
Adding password for user agent -
Convert the htpasswd file into a Kubernetes secret.
kubectl create secret generic basic-auth --from-file=auth --namespace monitoringOutput:
secret "basic-auth" created -
Navigate back to Palette, and review the cluster profile you created for the monitoring stack. From the left Main Menu > Profiles > select your cluster profile. Click on the Prometheus operator layer to edit the YAML.
-
Locate the
prometheus.ingresssection near the end of the file. Update the ingress configuration with the values provided below. Replace thehostsparameter with your custom domain.
ingress:
  enabled: true
  ingressClassName: nginx
  annotations:
    nginx.ingress.kubernetes.io/auth-type: basic
    nginx.ingress.kubernetes.io/auth-secret: basic-auth
    nginx.ingress.kubernetes.io/auth-realm: "Authentication Required"
  hosts:
- metrics.example.com -
Confirm your updates on the next screen that displays.
-
From the left Main Menu, select Clusters and access the monitoring stack host cluster.
-
Click on the Updates Available button to review the changes.
-
Accept the changes and select Confirm Updates.
The following steps can be complex, depending on your environment and your access. Discuss the remaining step with your network administrator team if you need additional guidance.
- Create a Canonical Name (CNAME) record for each of the following services and add the load balancer hostname to the CNAME record value. Use the table below to identify which mapping to use between the domain and each load balancer hostname.
| Service | Domain | CNAME Value Example |
|---|---|---|
nginx-ingress-controller | metrics.example.com | a57b622a0c0a148189ed00df614481c9-1803006767.us-east-1.elb.amazonaws.com |
prometheus-operator-kube-prometheus-stack-grafana | monitoring.example.com | a702f8a14b9684a30b18b875d2cca997-1676466159.us-east-1.elb.amazonaws.com |
You can also use kubectl to retrieve the load balancer hostname.
Grafana:
kubectl get service prometheus-operator-kube-prometheus-stack-grafana -n monitoring -o jsonpath='{.status.loadBalancer.ingress[0].hostname}'
Prometheus:
kubectl get service nginx-ingress-controller --namespace nginx -o jsonpath='{.status.loadBalancer.ingress[0].hostname}'
-
Create a public certificate for each domain. If you are using a public cloud provider, use the native certificate manager service to generate a public certificate that you can attach to the load balancers with minimal overhead. On-prem, use the default certificate manager used by your organization.
-
Update the network rules for each of the load balancers to allow inbound port 443.
- Next, update the load balancer listeners to forward requests from port 443 to the respective target port on the monitoring stack. The following table will map the service's load balancer listener with the respective configuration. Refer to the architecture diagram from the introduction to help you visualize the mapping.
| Inbound Load Balancer Port | Domain | Monitoring Stack Port | Service |
|---|---|---|---|
| 443 | monitoring.example.com | Use the same instance port the original entry for port 80 is using. | prometheus-operator-kube-prometheus-stack-grafana |
| 443 | metrics.example.com | Use the same instance port the original entry for port 80 is using. | nginx-ingress-controller |
- Wait for the DNS changes to propagate. This can take up to five minutes.
Your monitoring stack is now enabled with authentication and network encryption.
Validate
To validate the monitoring stack is successfully deployed and ready to receive Prometheus agent requests, use the following steps.
-
Log in to Palette.
-
Navigate to the left Main Menu and select Clusters.
-
Select the monitoring stack cluster to review the details page.
-
Ensure the cluster is in Running state.
-
Next, open up your web browser and visit the domain name you specified for the Grafana dashboard. Example:
https://monitoring.example.com.
-
Log in to the Grafana dashboard using the user
adminand the password you specified in the cluster profile. -
After you have verified you can log in to the Grafana dashboard, open a new tab and visit the Prometheus endpoint. Example:
https://metrics.example.com -
Log in with the user
agentand use the password you specified in the htpasswd file.
A common error is not updating the network rules to allow inbound connections for port 443 to the load balancers. Ensure you have updated all the required network rules to allow inbound network requests for port 443.
Next Steps
Now that you have a monitoring stack deployed and available in your environment, start adding the Prometheus agent to new and existing clusters. Check out the Enable Monitoring on Host Cluster to get started.