Enable Monitoring on Host Cluster
Observability (O11y) of Kubernetes clusters and their metrics is an important operational capability. Palette provides a pack that collects metrics from host clusters, which can be scraped by a monitoring stack.
The steps below will teach you how to create a Prometheus agent cluster add-on profile to deploy on the host clusters you would like to monitor. Creating an add-on profile makes it easier for you to deploy the Prometheus agent to other host clusters in the future. You will use this add-on profile when deploying a new host cluster, but you can also apply the add-on profile to an existing cluster to send metrics to the monitoring stack.
Create Add-on Profile and Deploy Cluster
Use the following steps to create an add-on profile and deploy a host cluster with the Prometheus agent installed. You can choose to deploy the Prometheus agent with or without authentication and encryption.
Prerequisites
-
A monitoring stack. Check out the Deploy Monitoring Stack guide to learn how to deploy a monitoring stack in your Palette environment.
-
An infrastructure provider environment registered in Palette. Refer to the Clusters documentation for guidance on how to register your infrastructure provider environment in Palette.
Without Authentication
-
Log in to Palette.
-
Navigate to the left Main Menu and select Profiles.
-
Click on Add Cluster Profile to create a new cluster profile.
-
Provide the cluster profile a name and select the type Add-on. Click on Next.
-
In the following screen, select Add New Pack.
-
Use the following information to find the Prometheus Agent pack.
- Pack Type: Monitoring
- Registry: Public Repo
- Pack Name: Prometheus Agent
- Pack Version: 19.0.X or newer.
-
Review the YAML configuration on the right. Navigate down the file until you find the parameter
urlin theremoteWritesection. TheremoteWrite.urlis exposed by the monitoring stack. The Prometheus server URL can be found by reviewing the details of the monitoring stack. Use the URL exposed by the Prometheus service.The following image displays the cluster details page of a monitoring stack. Use the URL exposed for port 9090 to populate the
remoteWrite.urlparameter.
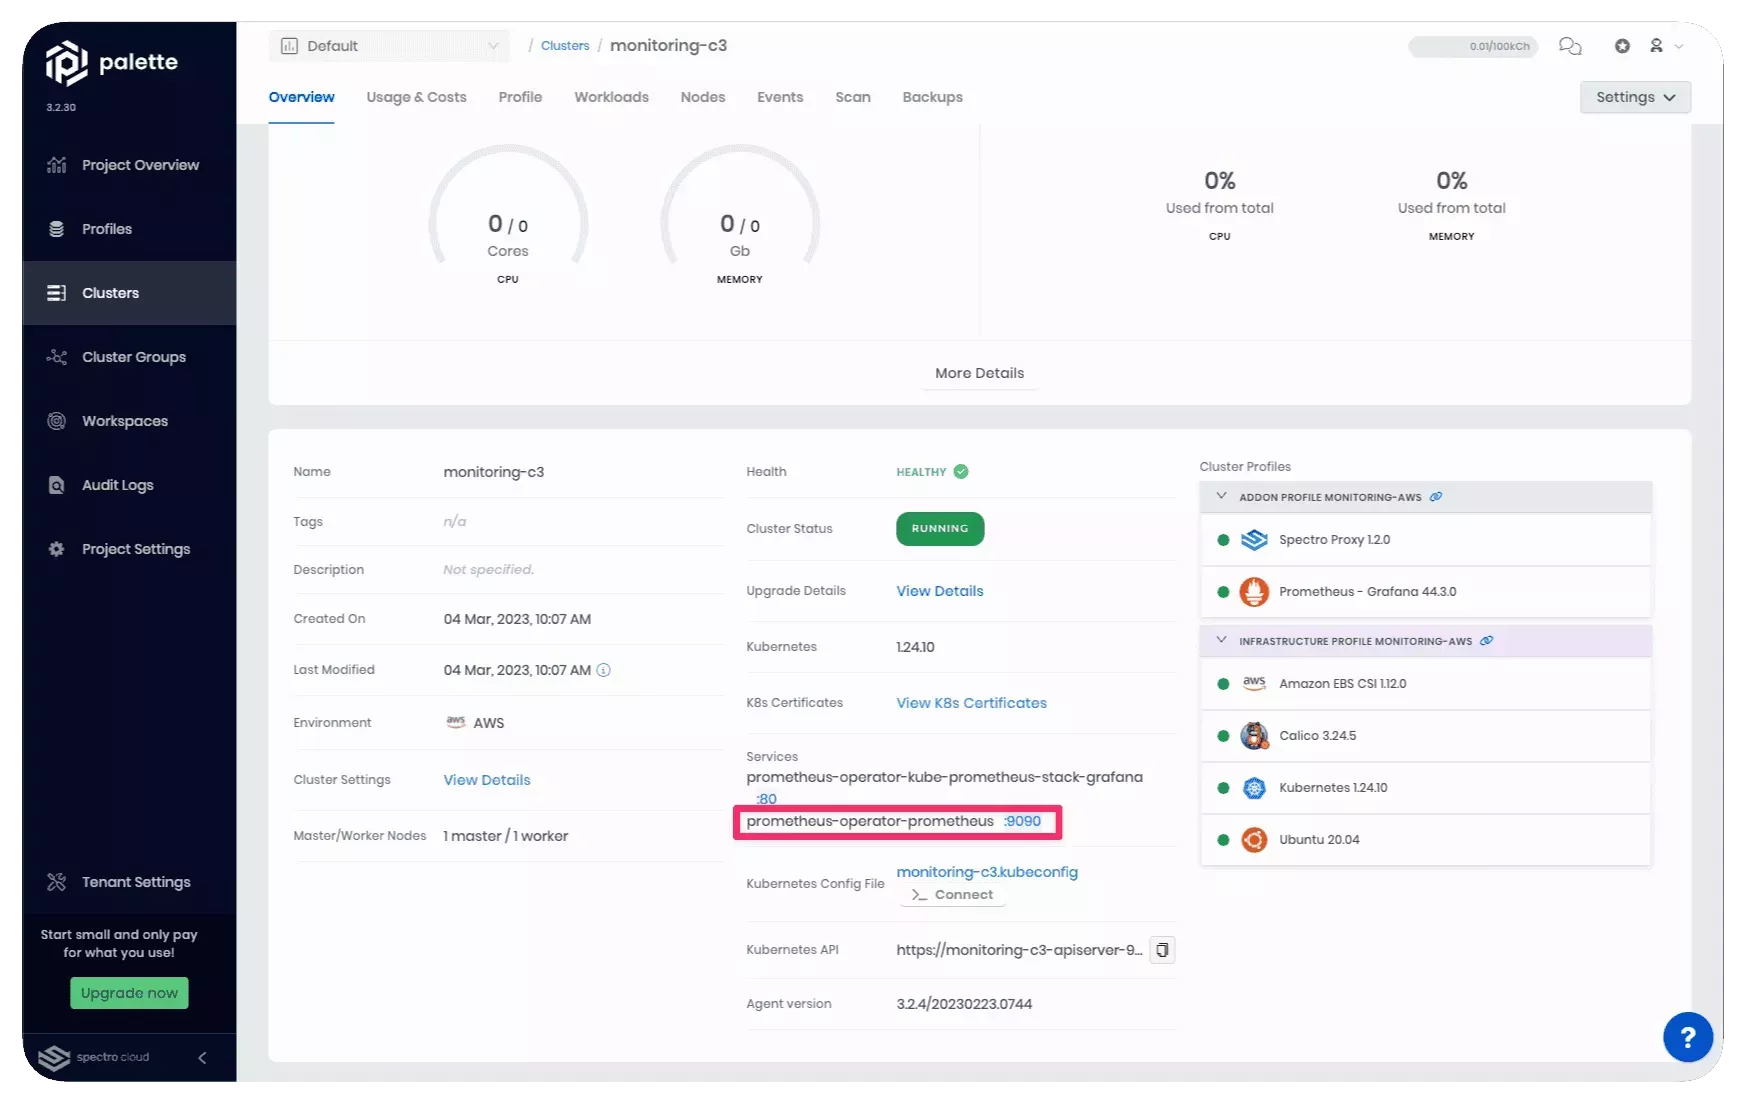
The Prometheus server URL must be in the format of http://HOST:PORT/api/v1/write. Example:
http://a2c938972938b4f0daee5f56edbd40af-1690032247.us-east-1.elb.amazonaws.com:9090/api/v1/write
charts:
  prometheus:
    server:
      remoteWrite:
        - url: "http://a2c938972938b4f0daee5f56edbd40af-1690032247.us-east-1.elb.amazonaws.com:9090/api/v1/write"
-
Confirm your changes by selecting Confirm & Create.
-
Click on Add New Pack.
-
Use the following information to find the Spectro Cluster Metrics pack.
- Pack Type: Monitoring
- Registry: Public Repo
- Pack Name: Spectro Cluster Metrics
- Pack Version: 3.3.X or newer
-
Use the default values. Confirm your changes by selecting Confirm & Create.
-
Click on Next to review the cluster profile. Save the cluster profile.
-
Navigate to the left Main Menu and select Clusters.
-
Click on Add New Cluster. Select Deploy New Cluster.
-
Pick the infrastructure provider you selected for the cluster profile you created earlier.
-
Assign a name to the host cluster and select the registered account that will deploy it. Click on Next.
-
Select a cluster profile to apply to your cluster. Click on Next.
-
The next screen displays all the layers of your cluster profile. You need to apply your add-on profile to this cluster profile. Click on the + button above the cluster profile layers.
-
Select the add-on profile you created earlier. Selecting the add-on profile ensures the Prometheus agent is installed with the correct configuration. Click on Next to proceed.
-
Complete the remainder of the cluster creation process.
After the cluster deployment process, you will have a host cluster with the Prometheus agent installed and ready to send metrics to the monitoring stack.
Refer to the Validate section to learn how to validate the Prometheus agent is successfully installed and sending metrics to the monitoring stack.
With Authentication and Encryption
-
Log in to Palette.
-
Navigate to the left Main Menu and select Profiles.
-
Click on Add Cluster Profile to create a new cluster profile.
-
Provide the cluster profile a name and select the type Add-on. Click on Next.
-
In the following screen, select Add New Pack.
-
Use the following information to find the Prometheus Agent pack.
- Pack Type: Monitoring
- Registry: Public Repo
- Pack Name: Prometheus Agent
- Pack Version: 19.0.X or newer.
-
Review the YAML configuration on the right. Scroll down in the file until you find the parameter
urlin theremoteWritesection. TheremoteWrite.urlis exposed by the monitoring stack. You can find the Prometheus server URL by reviewing the details of the monitoring stack. Use the URL exposed by the Prometheus service.The following image displays the cluster details page of a monitoring stack. Use the URL exposed for port 9090 to populate the
remoteWrite.urlparameter.
The Prometheus server URL must be in the format http://HOST:PORT/api/v1/write. Example:
https://metrics.example.com:9090/api/v1/write
charts:
  prometheus:
    server:
      remoteWrite:
        - url: "https://metrics.example.com:9090/api/v1/write"
- Add the
basic_authparameters shown below. Replace<USERNAME>and<PASSWORD>with the actual credential values. Use the username you created to authenticate with the Prometheus API server. If you followed the Deploy a Monitoring Stack with authentication guide, then the username isagent.
charts:
  prometheus:
    server:
      remoteWrite:
        - url: "http://metrics.example.com:9090/api/v1/write"
          remote_timeout: "5s"
          basic_auth:
            username: "<USERNAME>"
            password: <PASSWORD>
-
Confirm your changes.
-
Click on Add New Pack.
-
Use the following information to find the Spectro Cluster Metrics pack.
- Pack Type: Monitoring
- Registry: Public Repo
- Pack Name: Spectro Cluster Metrics
- Pack Version: 3.3.X or newer
-
Use the default values. Confirm your changes by selecting Confirm & Create.
-
Click on Next to review the cluster profile. Save the cluster profile.
-
Navigate to the left Main Menu and select Clusters.
-
Click on Add New Cluster. Select Deploy New Cluster.
-
Pick the infrastructure provider you selected for the cluster profile you created earlier.
-
Assign a name to the host cluster and select the registered account that will deploy it. Click on Next.
-
Select a cluster profile to apply to your cluster. Click on Next.
-
The next screen displays all the layers of your cluster profile. You need to apply your add-on profile to this cluster profile. Click on the + button above the cluster profile layers.
-
Select the add-on profile you created earlier. Selecting the add-on profile ensures the Prometheus agent is installed with the correct configuration. Click on Next to proceed.
-
Complete the remainder of the cluster creation process.
When you deploy the cluster deployment, you will have a host cluster with the Prometheus agent installed and ready to send metrics to the monitoring stack.
Validate
To validate that the Prometheus agent is successfully installed and sending metrics to the monitoring stack, use the following steps.
-
Log in to Palette.
-
Navigate to the left Main Menu and select Clusters.
-
Select the monitoring stack cluster to review the details page.
-
Ensure the cluster is in the Running state.
-
Click on the exposed service URL for the service prometheus-operator-kube-prometheus-stack-grafana.
-
Log in to the Grafana dashboard using the user
adminand the password you specified in the cluster profile. -
In the Grafana dashboard, click on the left Main Menu and click on Dashboards. Palette exposes a set of Grafana dashboards by default.
-
Select the Spectro Cloud/ Spectro Clusters dashboard.
-
Use the cluster filter and review the list of available clusters. Select your newly deployed cluster to review its metrics.
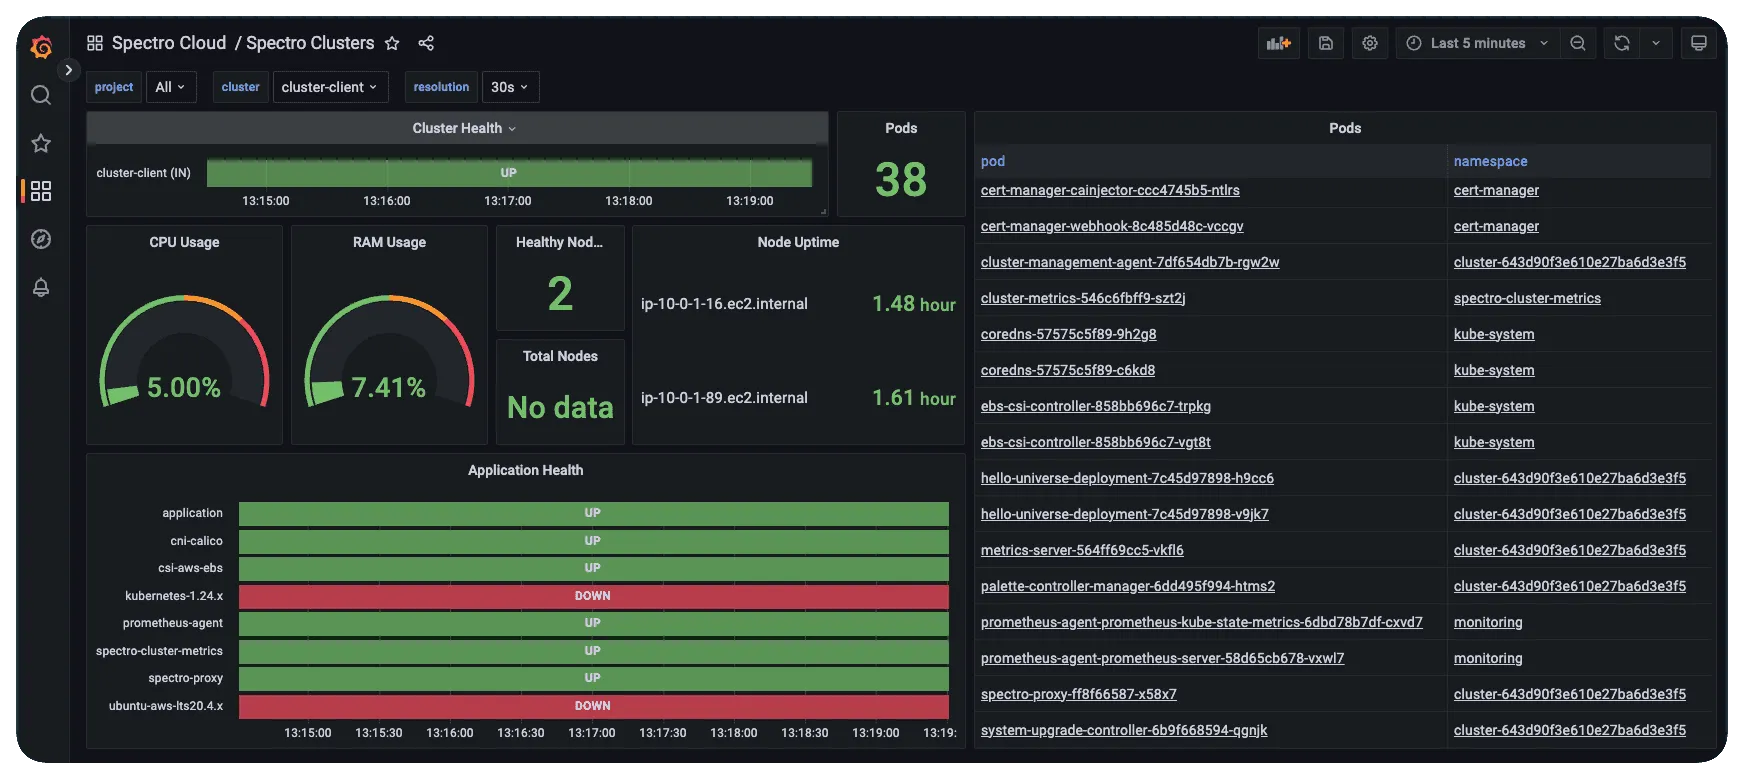
Pods without the defined attributes request and limit will display no metrics data in the Grafana out-of-the-box
Kubernetes Pods dashboard.
Use the other dashboard created by Palette to learn more about your environment.
Next Steps
Visit your Grafana dashboard and explore the Palette-created dashboard to learn more about your environment. To learn how to create dashboards tailored to your environment, check out the Grafana tutorials.