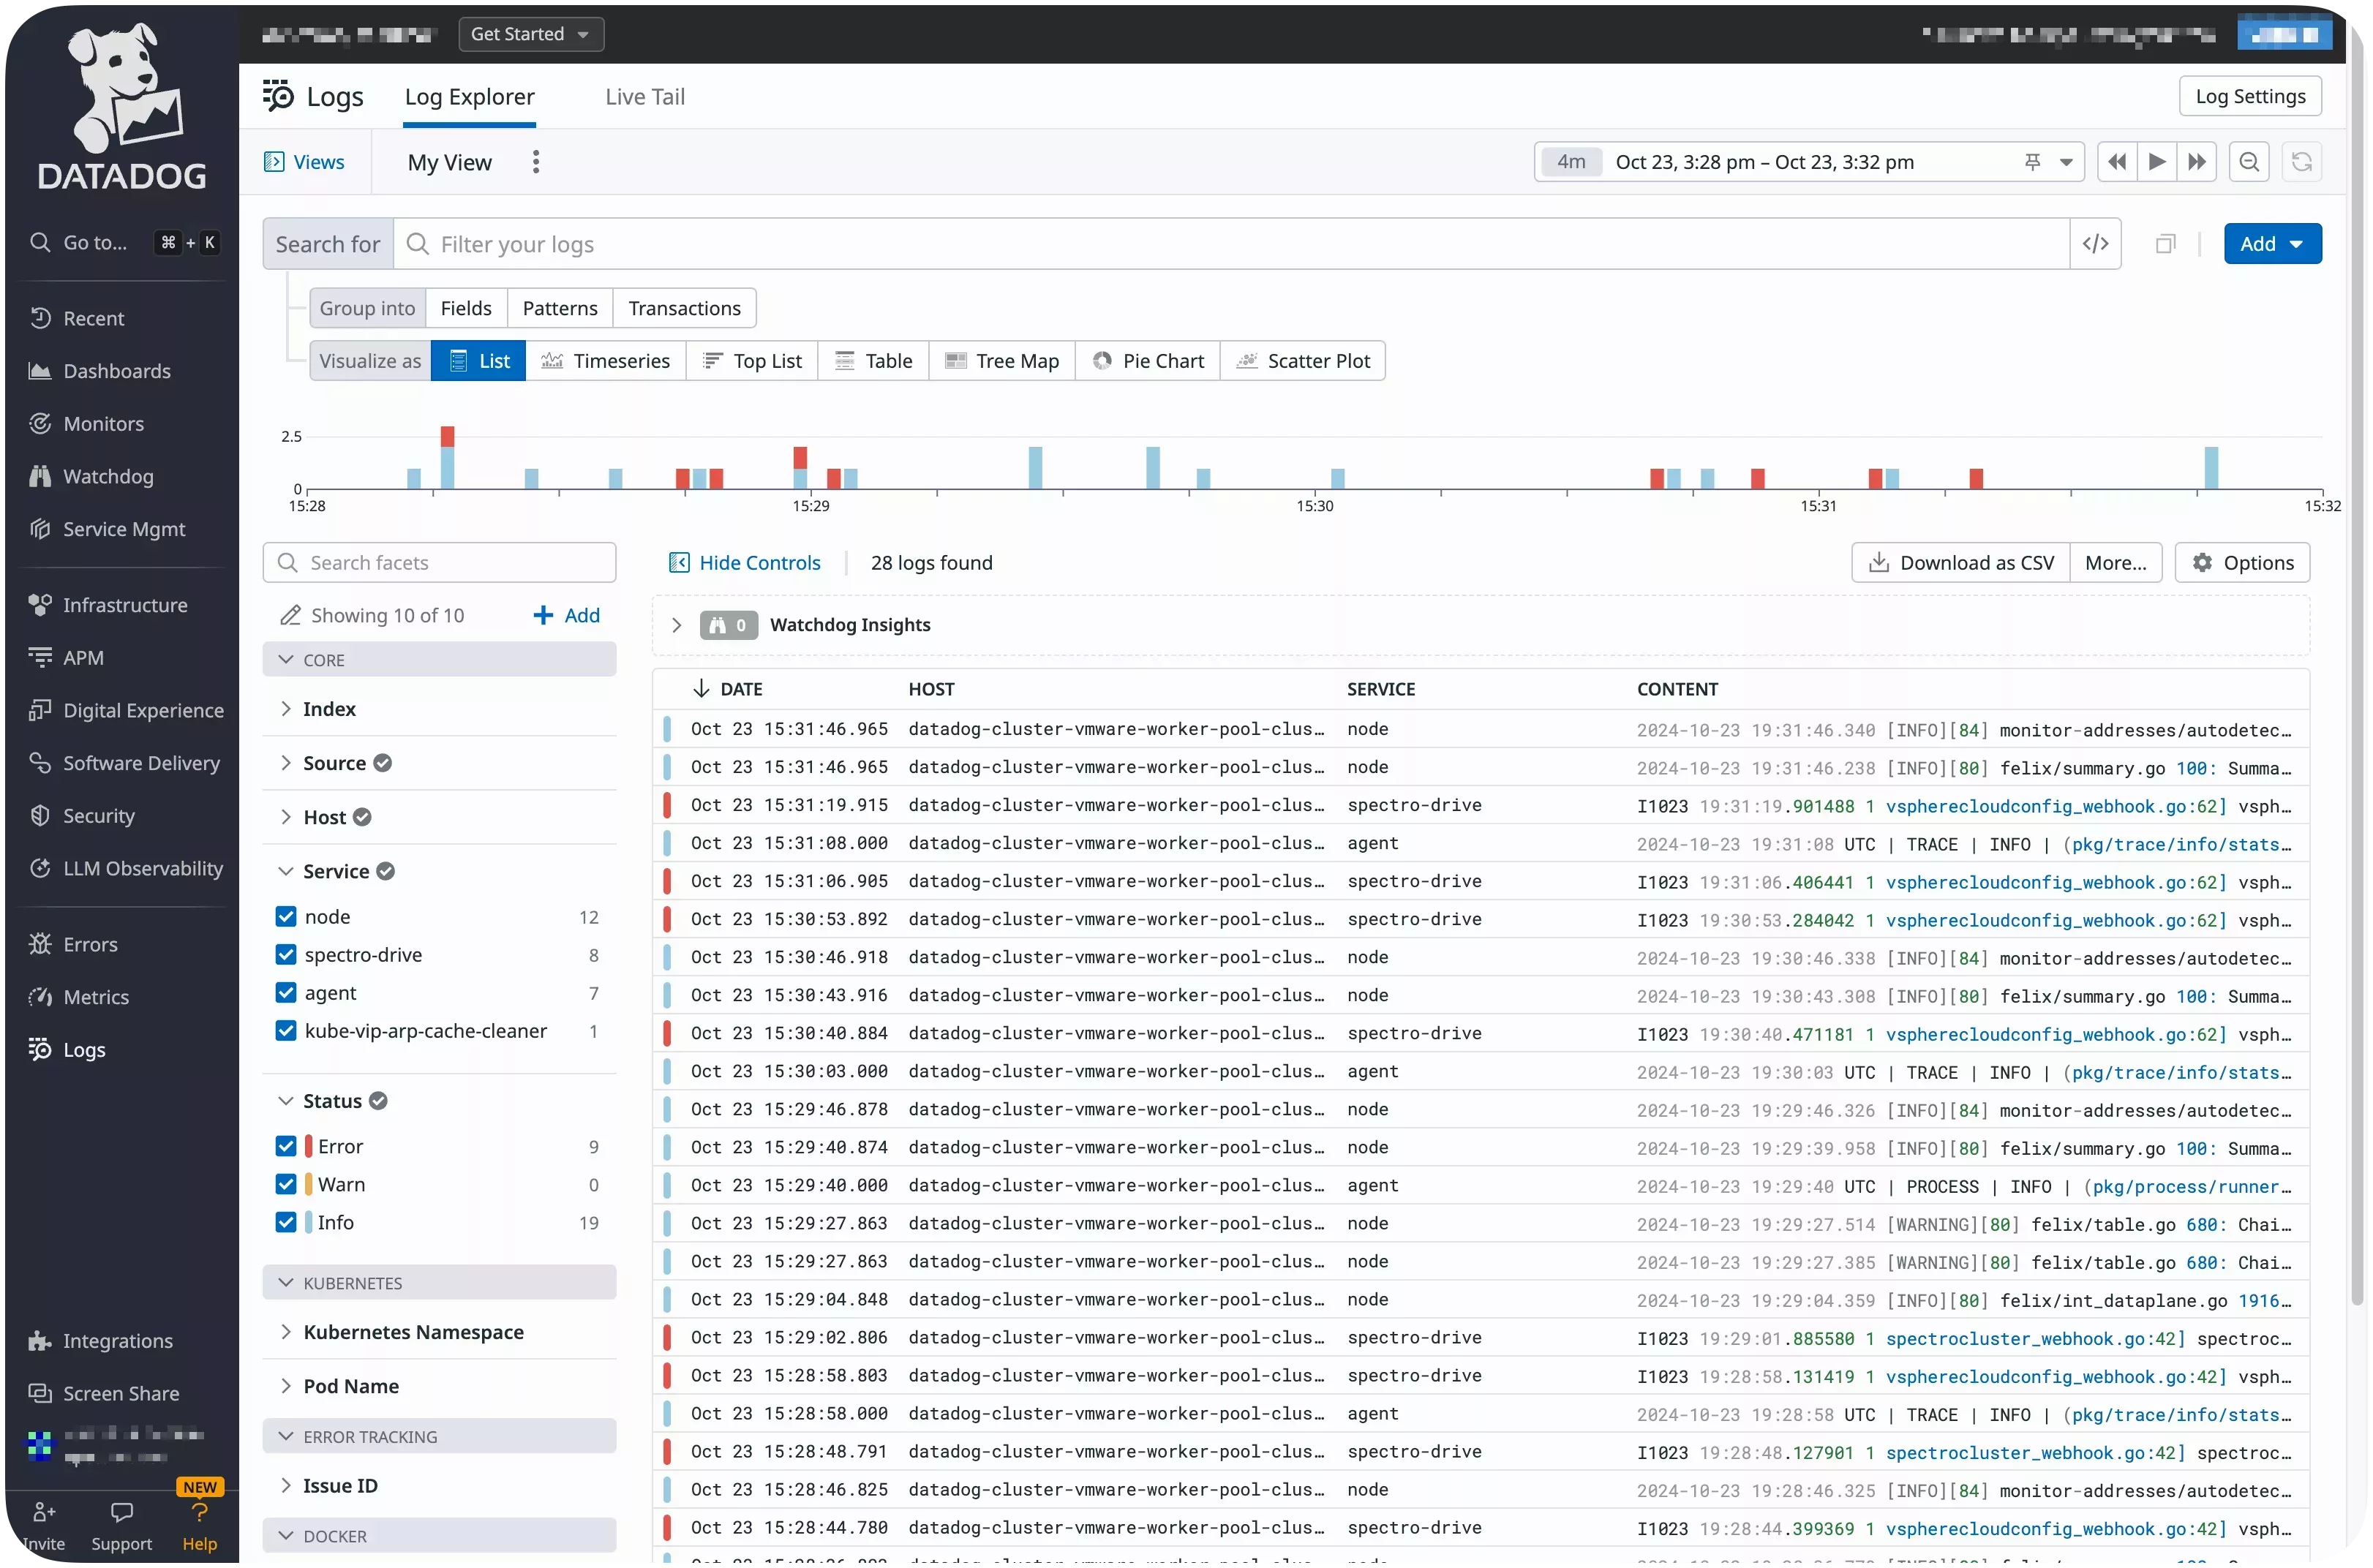
Monitor Host Clusters with Datadog
You can use Datadog, a monitoring and analytics tool, to visualize the audit logs of your host clusters.
This guide will help you through the process of configuring your clusters deployed with Palette to export audit logs to Datadog.
Prerequisites
-
A Palette account with tenant admin access.
-
A Datadog account. Visit the Datadog official website to create a Datadog account.
-
An active host cluster. Refer to the Getting Started tutorials for instructions on how to deploy a cluster.
-
Kubectl installed and configured to access your host cluster. Refer to the Access Cluster with CLI page for guidance on how to access your cluster with the kubectl CLI.
Configure Host Cluster to Export Logs
-
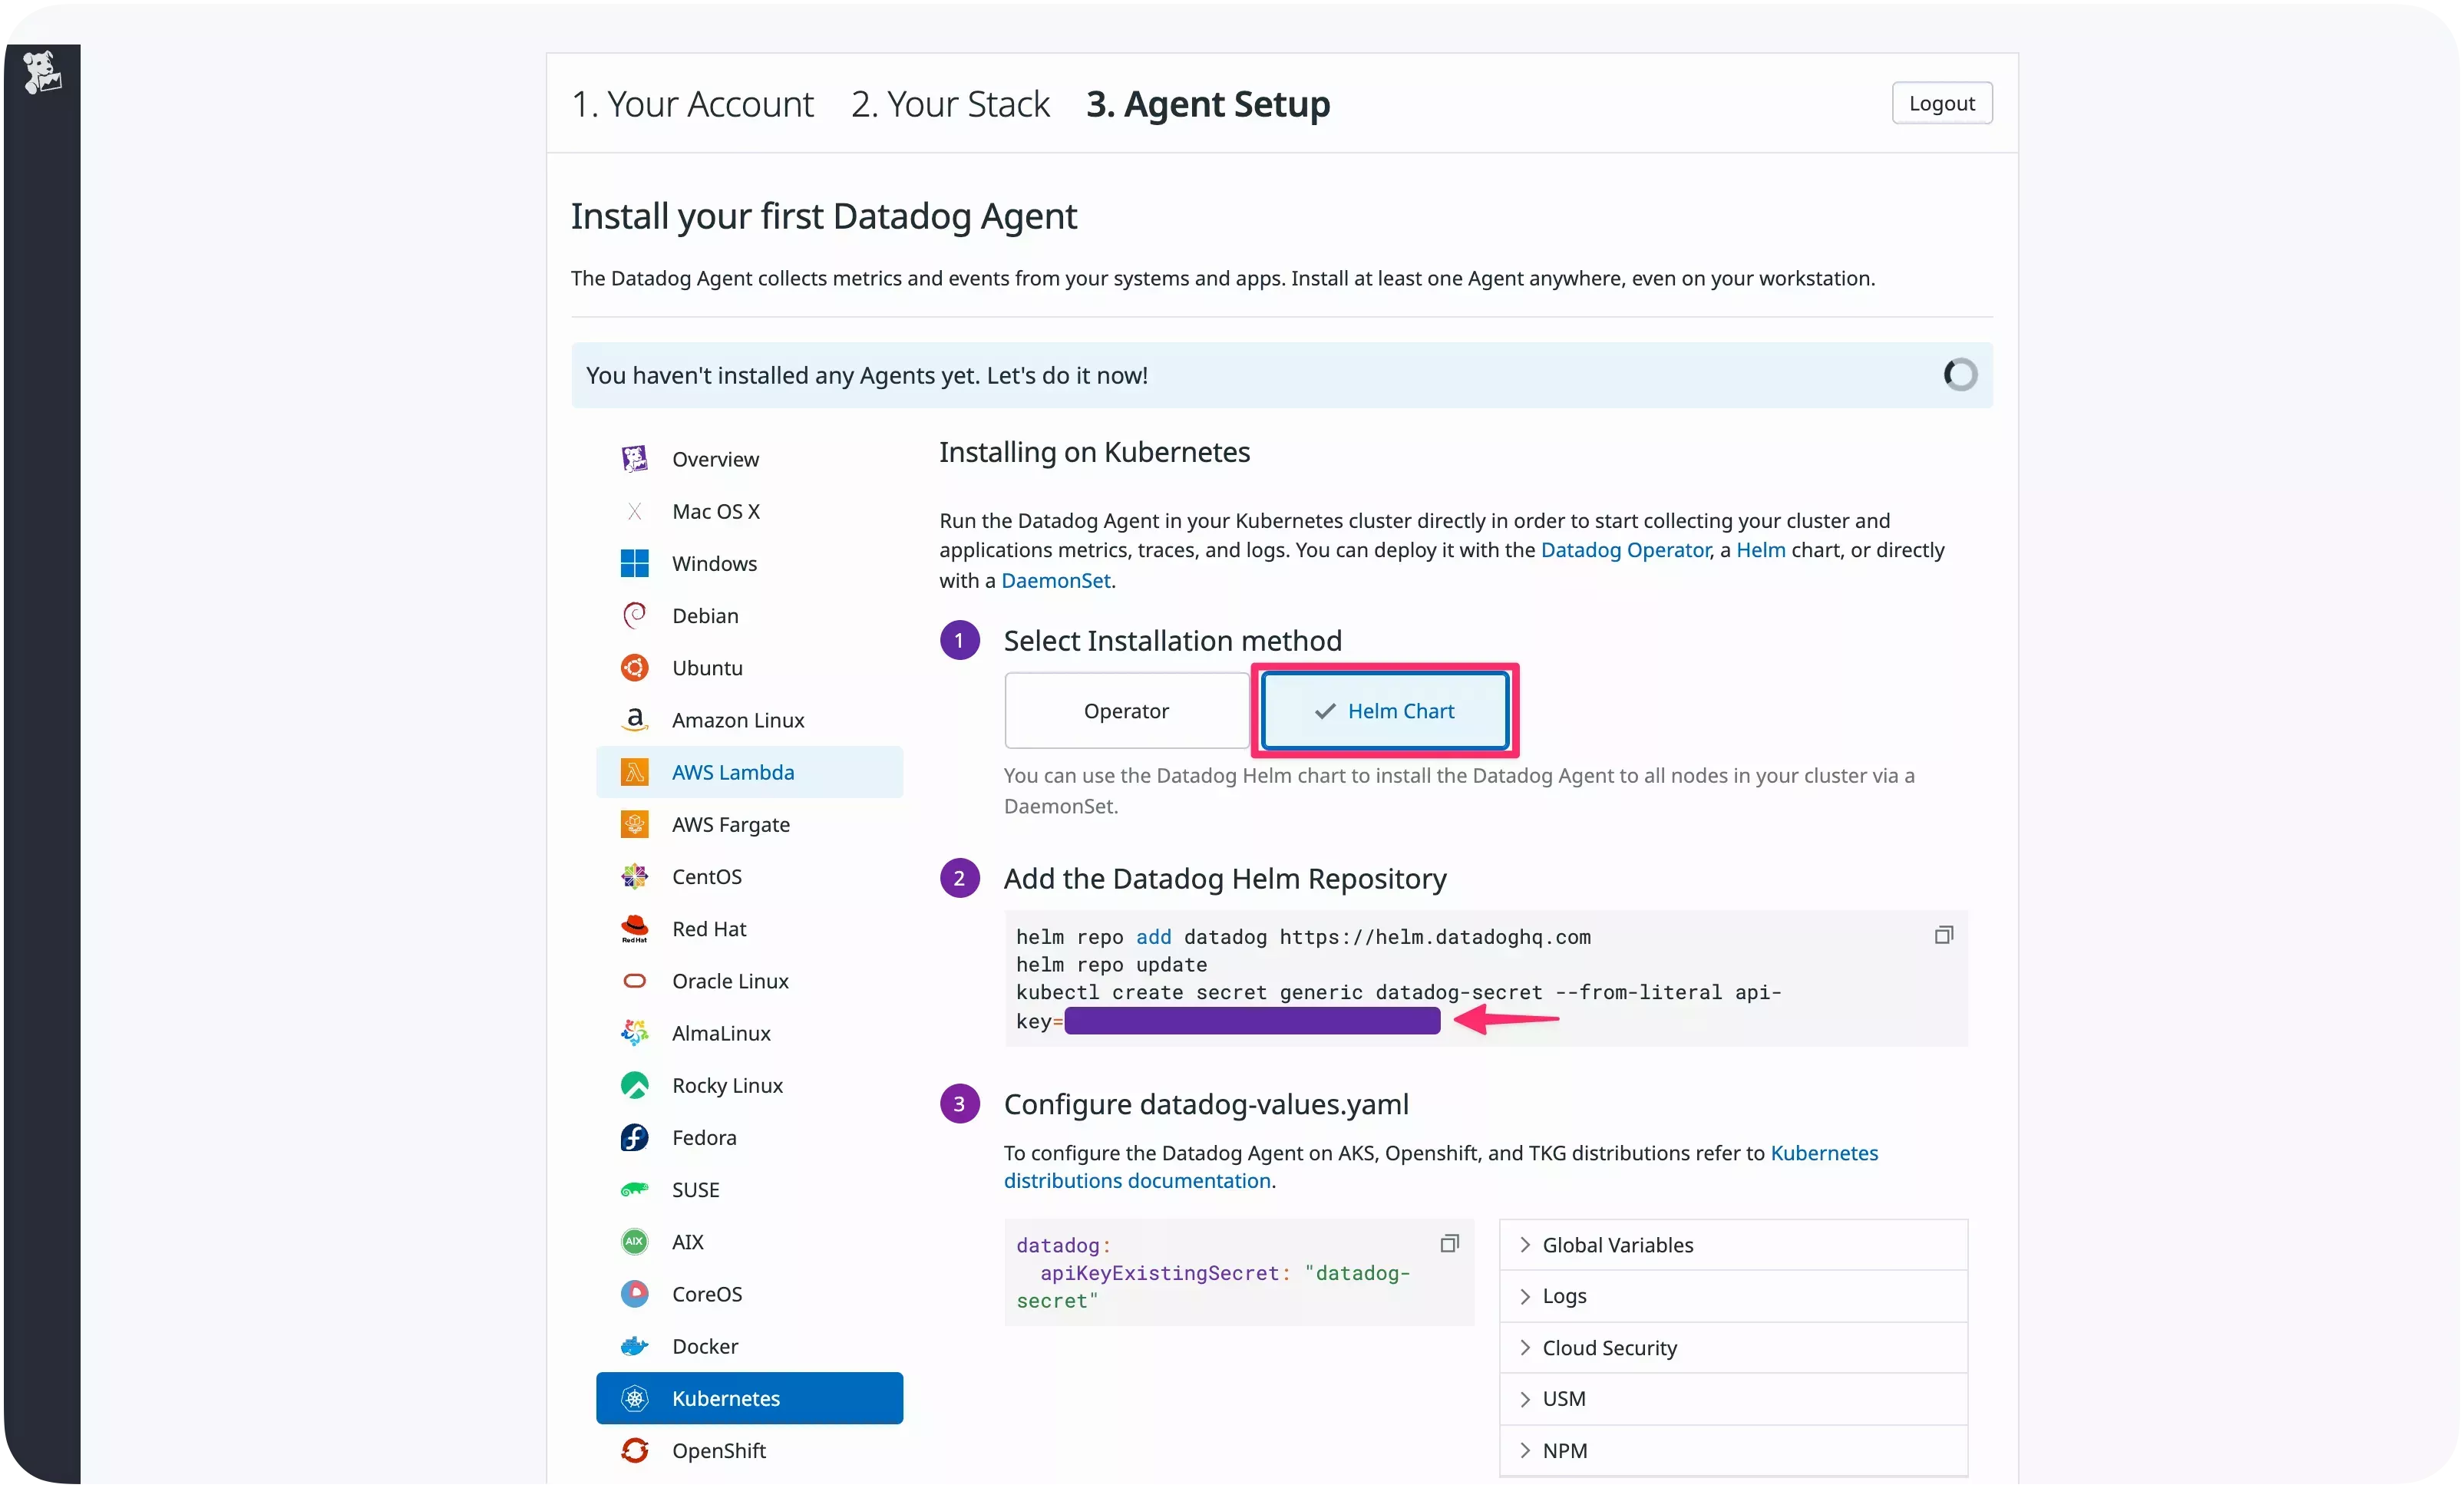
Log in to Datadog and select Kubernetes from the left Main Menu.
-
Select Helm Chart. Datadog provides you with an API key. Copy and save the key.
-
Log in to Palette.
-
From the left Main Menu, select Tenant Settings.
-
Click Registries and select Add New Helm Registry under Helm Registries to add the Datadog Helm repository.
-
Assign the registry a name, for example,
Datadog, and includehttps://helm.datadoghq.comas the endpoint. Click Confirm. The synchronization may take a few minutes to complete.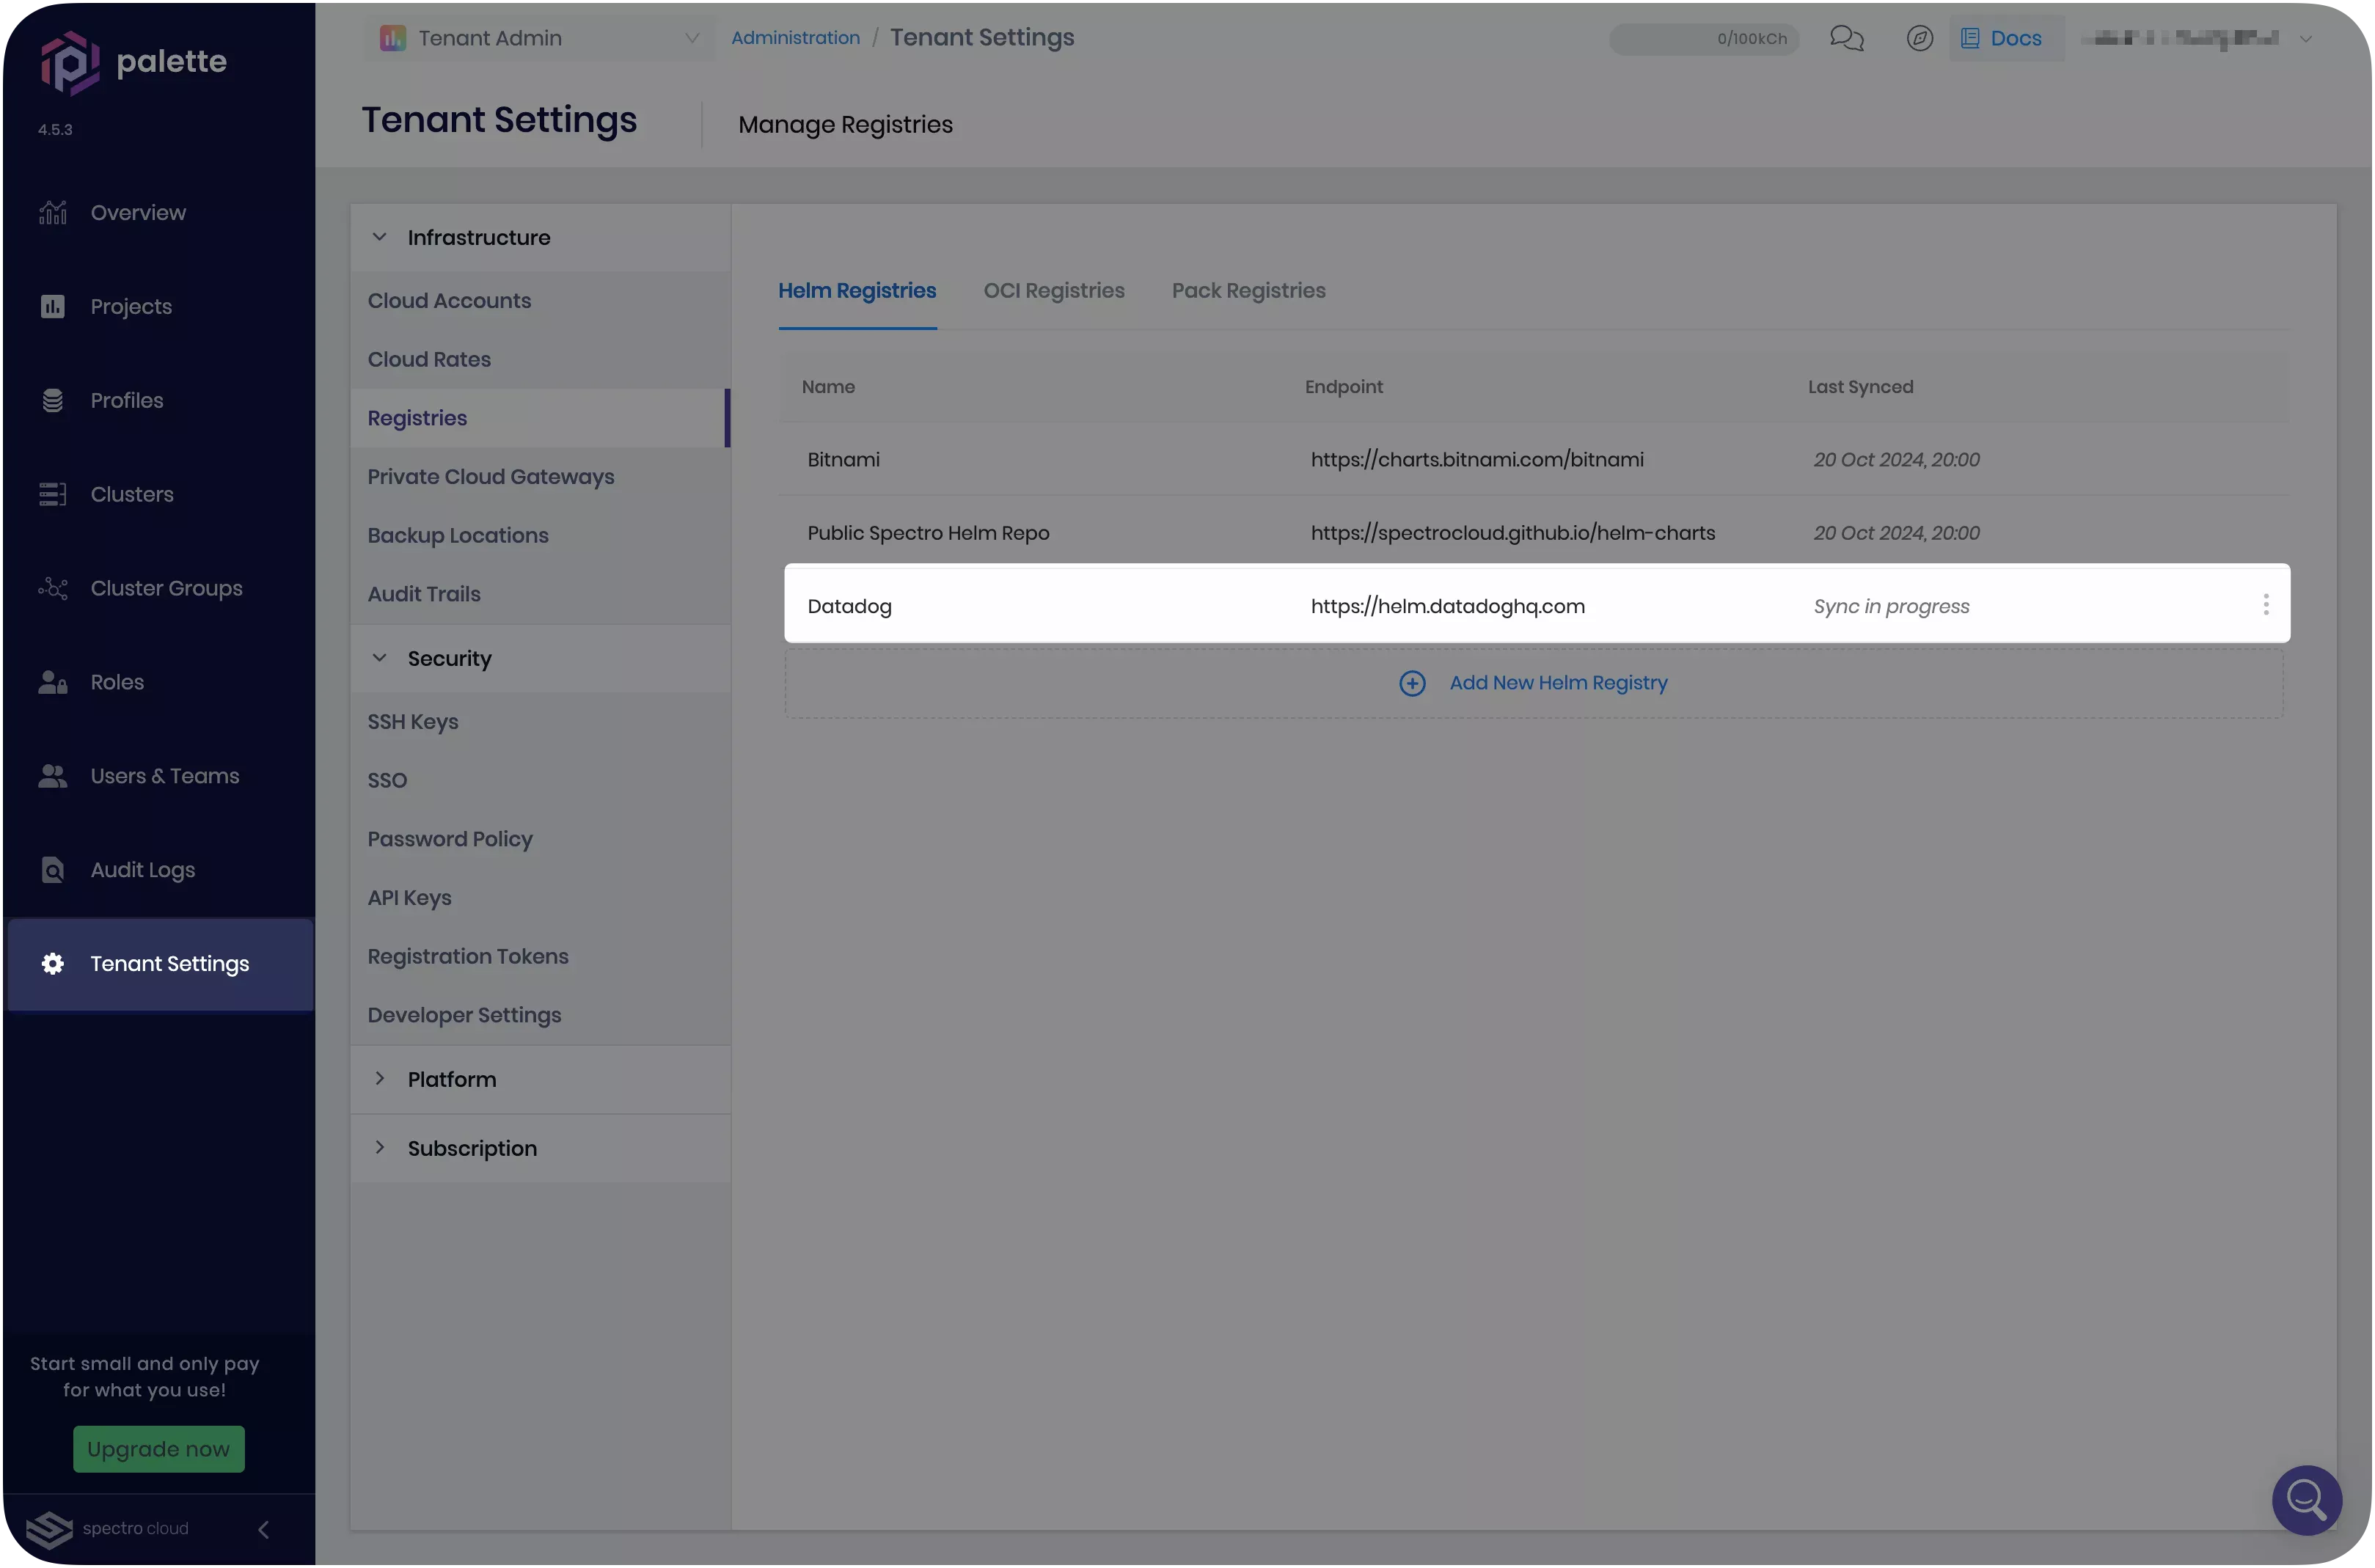
-
Once the synchronization is finished, click on Profiles from the left Main Menu and select Add Cluster Profile to create a Datadog add-on cluster profile.
-
Give the profile a name, select the type Add-on, and click Next.
-
Click on Add Helm chart, choose Public packs, and select the Datadog registry.
-
Next, select the latest version of the
datadogchart.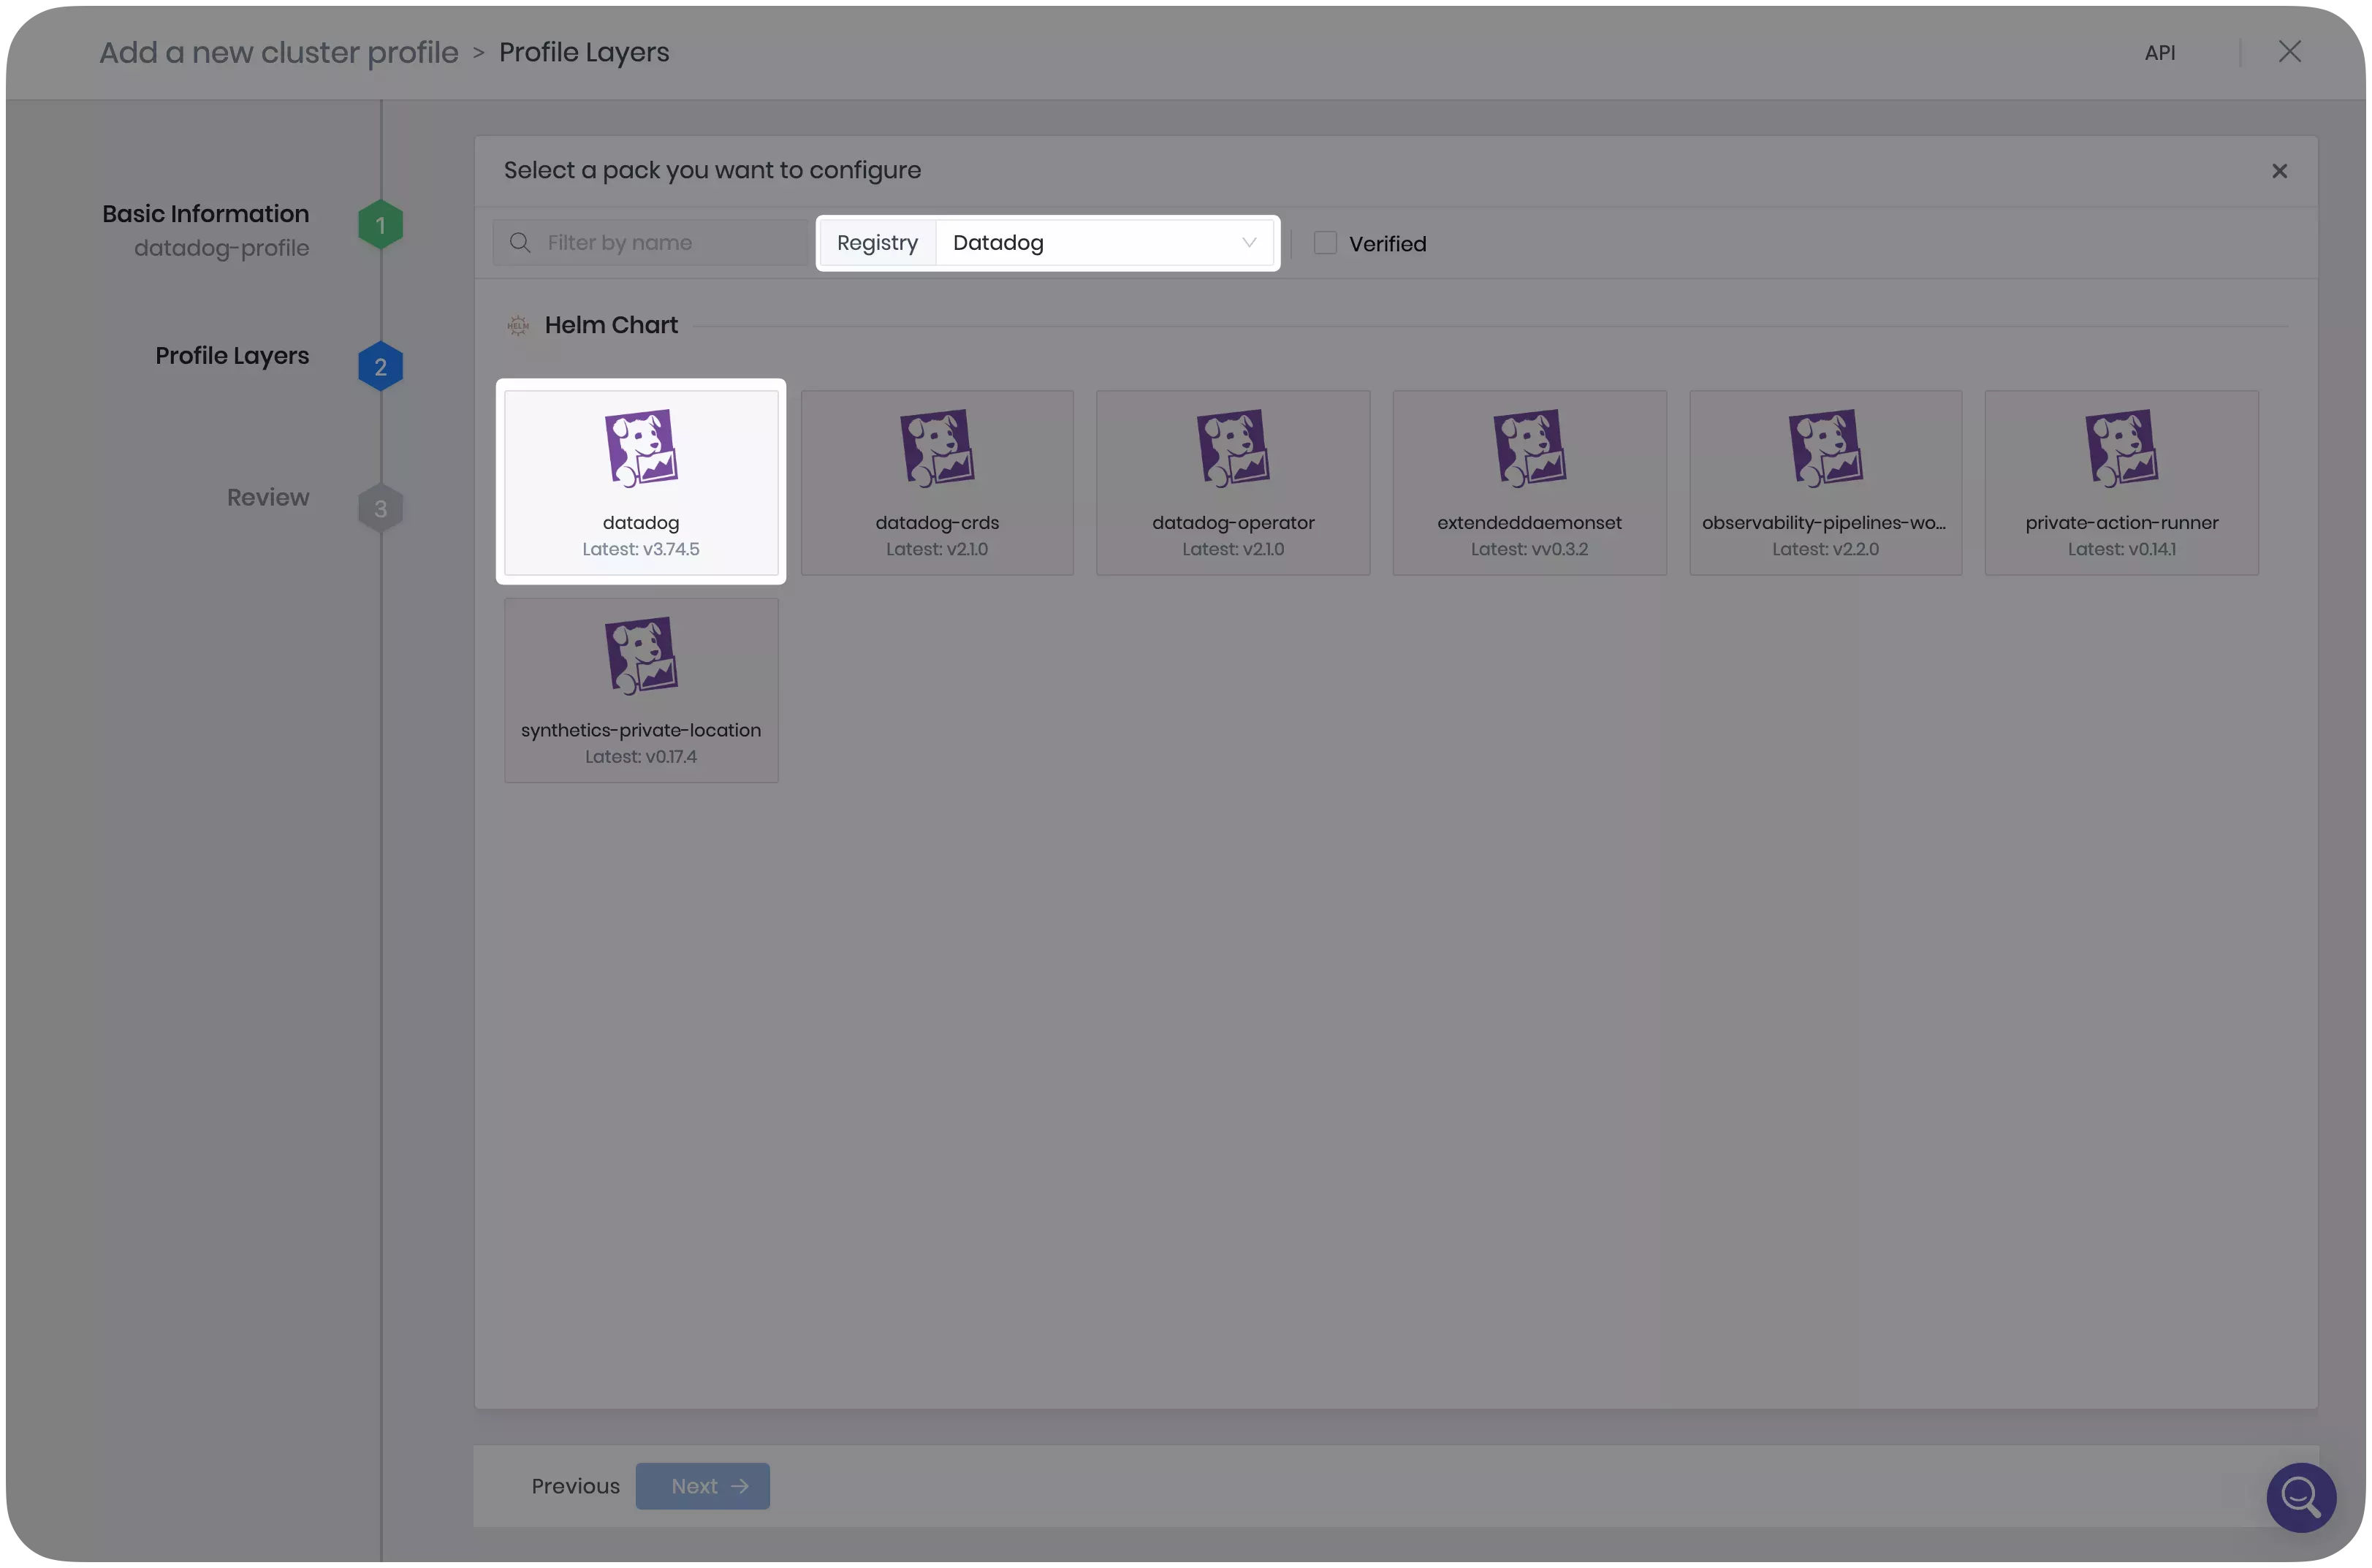
-
Click Values under Pack Details to configure the Datadog Helm chart. Modify the parameters according to the following table.
Parameter Modification pack.namespace Provide a namespace for the Datadog installation, for example, datadog.datadog.apiKey Insert your Datadog API key. datadog.site Insert your regional Datadog website, for example, us5.datadoghq.com. Refer to the Getting Started with Datadog Sites page for a complete list of websites.datadog.logs.enabled Set it to trueto enable the Datadog Agent log collection.datadog.logs.containerCollectAll Set it to trueto allow log collection for all containers.datadog.processAgent.processCollection Set it to trueto enable process collection.datadog.networkMonitoring.enabled Set it to trueto enable network performance monitoring.datadog.serviceMonitoring.enabled Set it to trueto enable universal service monitoring.datadog.securityAgent.compliance.enabled Set it to trueto enable the security agent. -
Next, paste the following snippet under the
clusterAgent.volumessection to enable the volume and volume mount for collecting audit logs. Replace/var/log/apiserverwith theaudit-logpath configured in the Kubernetes layer of your host cluster. You can find this path in the Kubernetes layer of your host cluster profile in Palette.volumes:
- hostPath:
path: /var/log/apiserver
name: auditdir
- name: dd-agent-config
configMap:
name: dd-agent-config
items:
- key: kubernetes-audit-log
path: conf.yaml
volumeMounts:
- name: auditdir
mountPath: /var/log/apiserver
- name: dd-agent-config
mountPath: /conf.d/kubernetes_audit.d -
Additionally, if your host cluster uses Kubernetes version 1.25 or later, add the following lines under the
pack.namespacesection to accommodate the elevated privileges required by the Datadog pods. Replace<k8s_version>with your cluster's Kubernetes version and only include the major and minor version following the lowercase letter v. For example,v1.30. Refer to the Deployment Violates Pod Security troubleshooting guide for more information.pack:
namespace: "datadog"
namespaceLabels:
"datadog": "pod-security.kubernetes.io/enforce=privileged,pod-security.kubernetes.io/enforce-version=v<k8s_version>" -
Once you finish making the necessary changes, click Confirm & Create, then select Next.
-
Review the cluster profile and click Finish Configuration.
-
In Palette, attach the Datadog add-on cluster profile to your host cluster. Refer to the Attach an Add-on Profile guide for instructions.
-
Open a terminal window and use the
catcommand to create a ConfigMap resource for the host cluster to collect data.cat << EOF > datadog-configmap.yaml
kind: ConfigMap
apiVersion: v1
metadata:
name: dd-agent-config
namespace: datadog
data:
kubernetes-audit-log: |-
logs:
- type: file
path: /var/log/apiserver/audit.log
source: kubernetes.audit
service: audit
EOF -
Issue the following command to apply the ConfigMap to your host cluster.
kubectl apply --namespace datadog --filename datadog-configmap.yamlconfigmap/dd-agent-config created -
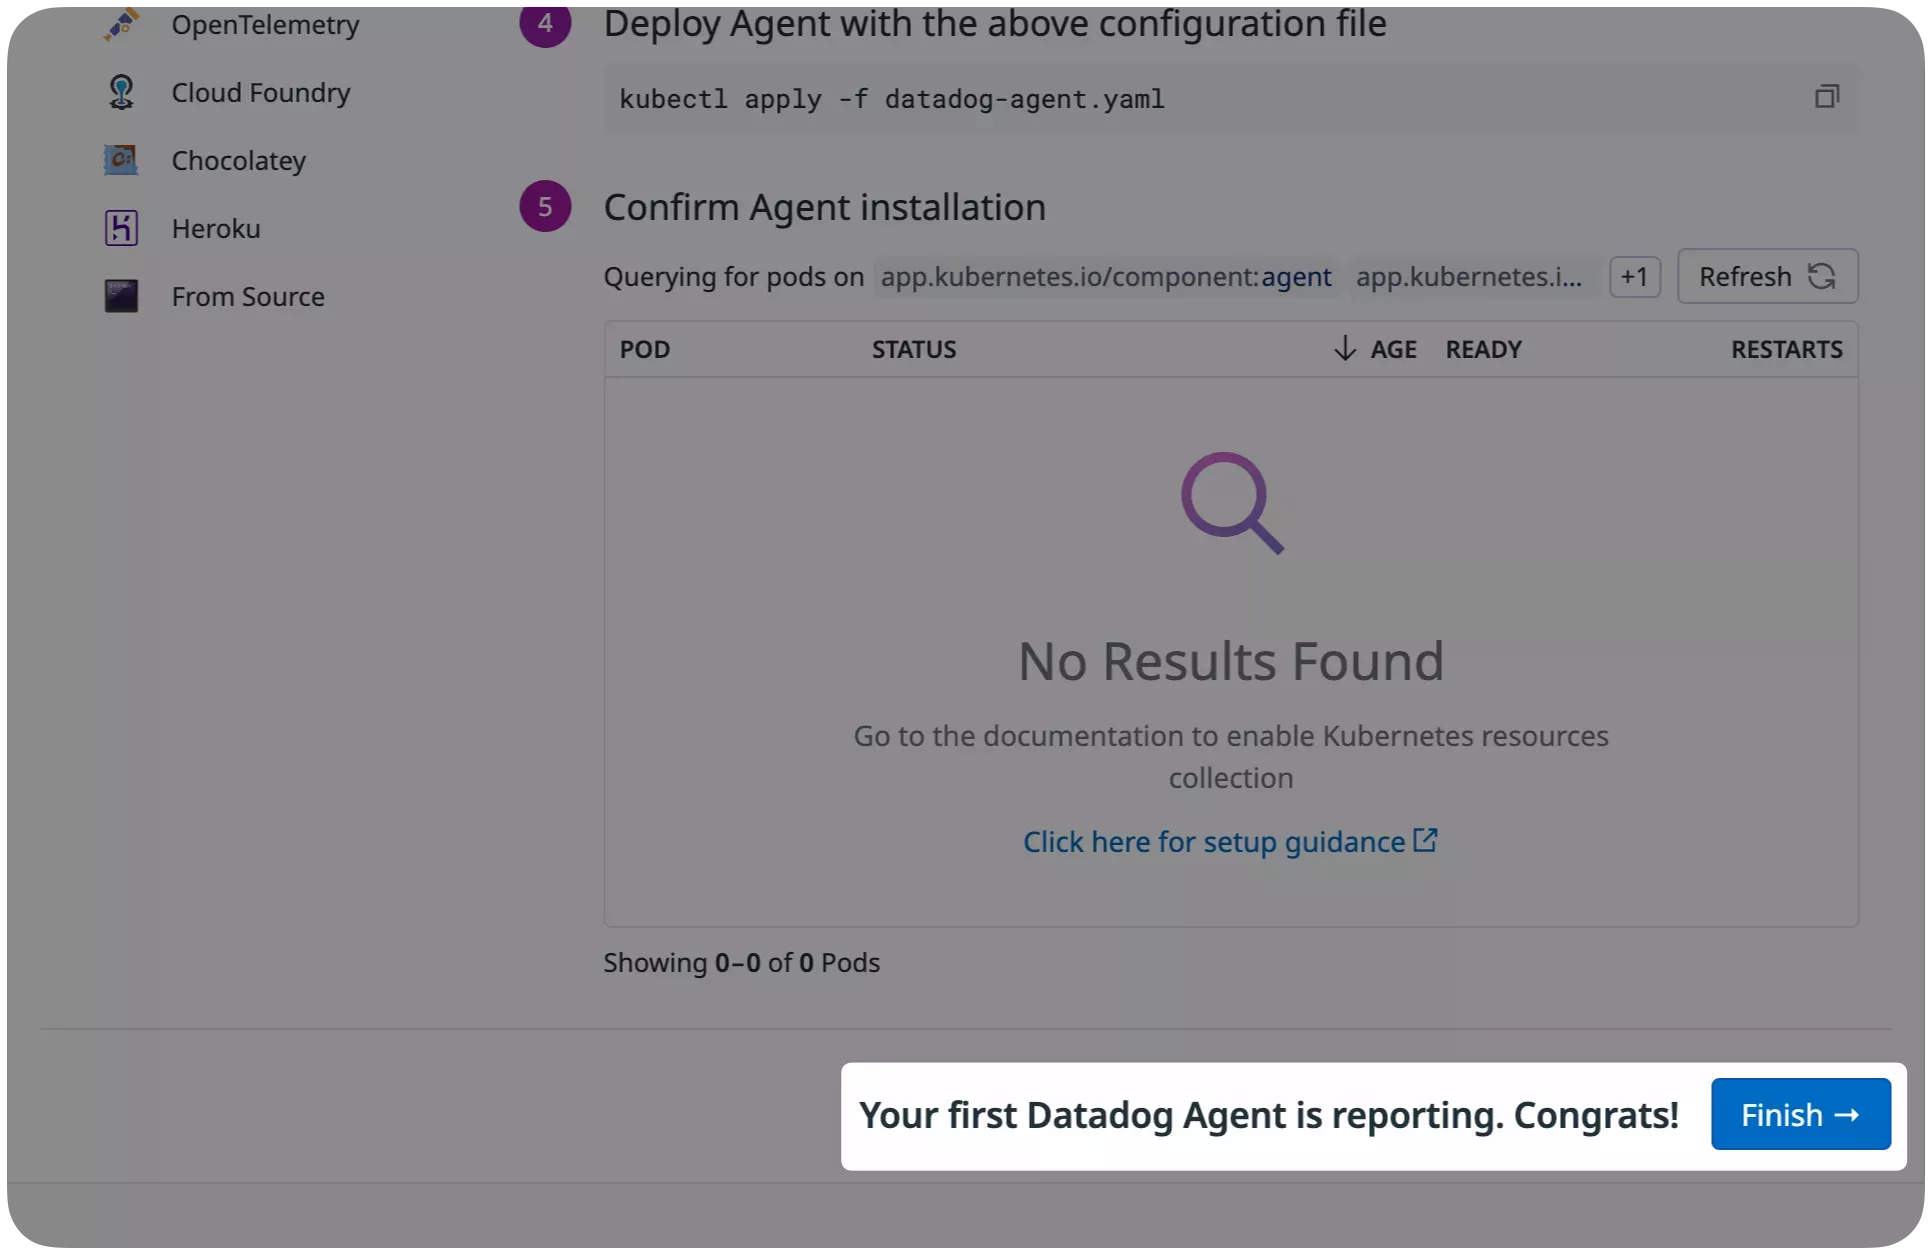
After a few minutes, the Datadog agent will start reporting. Log in to Datadog and select Kubernetes from the left Main Menu to verify that the audit logs are being transferred successfully to Datadog.
Validate
-
Log in to Datadog.
-
Click on Logs in the left Main Menu, select Explorer, and verify that your host cluster audit logs are visible.
